


RESOURCES | post
Array


This article is a continuation of a recent article on predicting “exotic” mineral scaling (1).
As discussed previously, mineral scaling can hinder fluid flow reducing operational efficiency, asset reliability and even continuity of operations in extreme situations. As oil & gas exploration & production move into deeper, over-pressured formations, scale management at high temperatures and pressures becomes even more challenging. Understanding the chemistry involved, gaining insights into the deposition of exotic scales, and reliably predicting the scaling tendency are critical to develop effective scale remediation technologies in oil and gas recovery processes.
In this article, we extend that discussion to some “common” mineral scales: calcite (calcium carbonate), gypsum (calcium sulfate dihydrate), anhydrite (calcium sulfate) and barite (barium sulfate). OLI Systems has developed a comprehensive thermodynamic model to predict scaling under conditions ranging from ambient to extreme (up to 300 °C and at least 1,700 atm). The model is based on OLI’s proprietary Mixed Solvent Electrolyte (MSE) thermodynamic framework (2). Several diagrams are given below that compare the MSE model predictions to experimental solubility data for these common scales over a wide range of temperature, pressure and salt compositions.
Calcium Carbonate
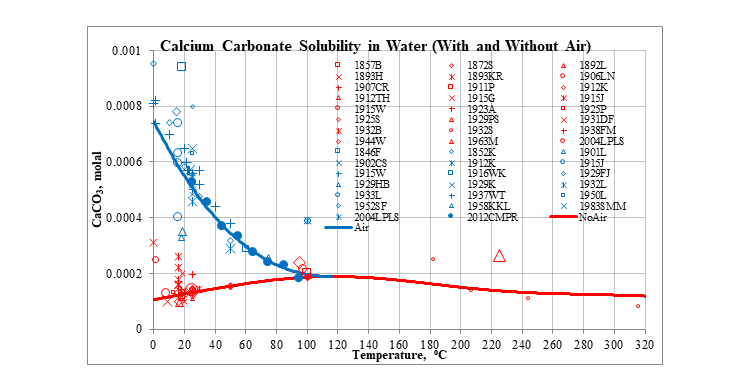
The plot below shows the solubility of calcium carbonate in water at saturation pressure. The solubility is low in the absence of air. However, at low temperatures, the small amount of carbon dioxide in air increases the solubility.
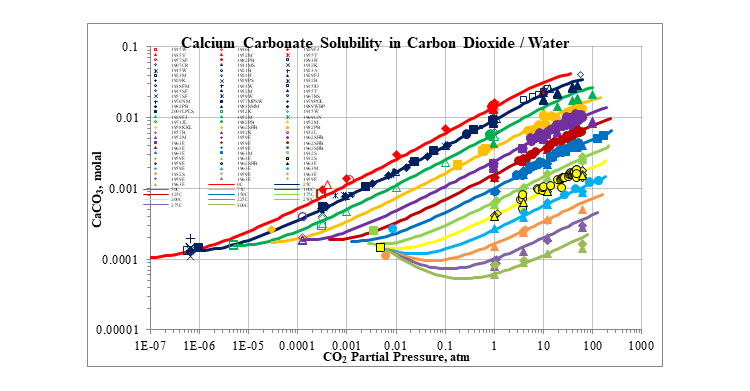
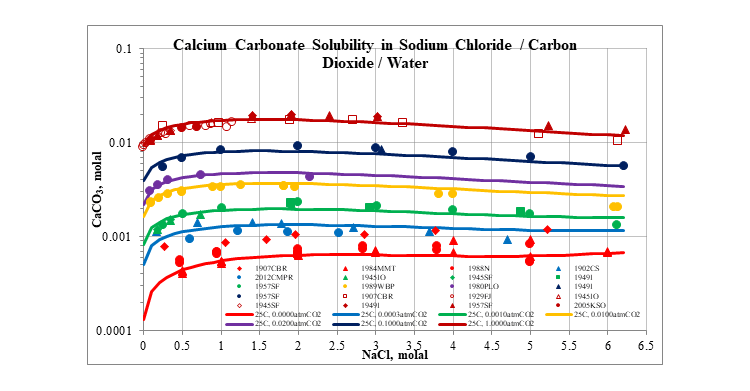
The next plot gives a more complete picture of the effect of the carbon dioxide partial pressure on the solubility of calcium carbonate. Generally, the solubility increases with increasing carbon dioxide partial pressure. The solubility usually decreases with increasing temperature.
The next plot shows the effect that a typical salt, sodium chloride, has on the solubility of calcium carbonate. The solubility increases at low sodium chloride concentrations, but flattens out at higher concentrations, up to the solubility limit of sodium chloride.
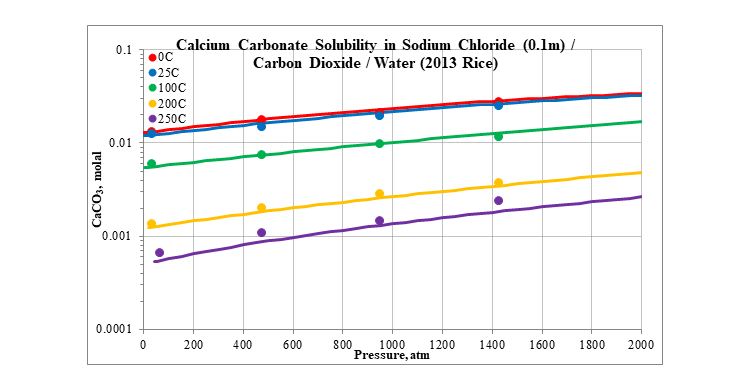
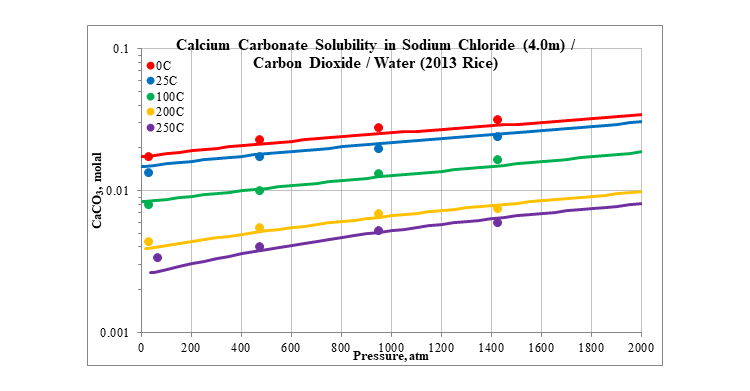
Finally, the next two plots show the effect of pressure on the solubility of calcium carbonate. The plots are for two different concentrations of sodium chloride, 0.1 and 4.0 molal. The solubility slightly increases as pressure increases.
Calcium Sulfate
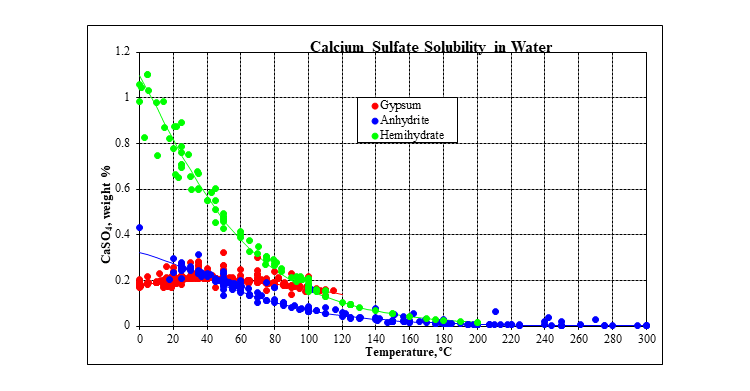
The plot below shows the solubility of calcium sulfate in water at saturation pressure. In addition to gypsum and anhydrite, there is a third calcium sulfate solid: hemihydrate. However, it is metastable over the entire temperature range. Gypsum is the stable solid up to about 40 °C. Anhydrite is the stable solid above that.
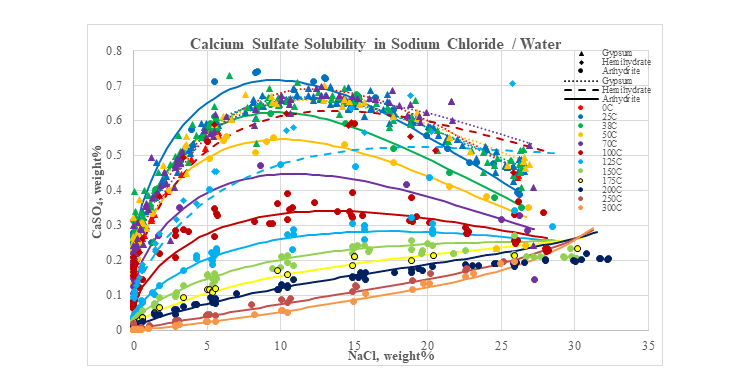
The next plot shows the effect that a typical salt, sodium chloride, has on the solubility of calcium sulfate. At low temperatures, the solubility goes through a maximum while at higher temperatures it increases as the sodium chloride concentration increases. Above 40 °C anhydrite is the stable phase. Below 40 °C gypsum is the stable phase at low sodium chloride concentrations, but anhydrite is the stable phase at high sodium chloride concentrations. Metastable predictions for all three solids are also shown in the plot.
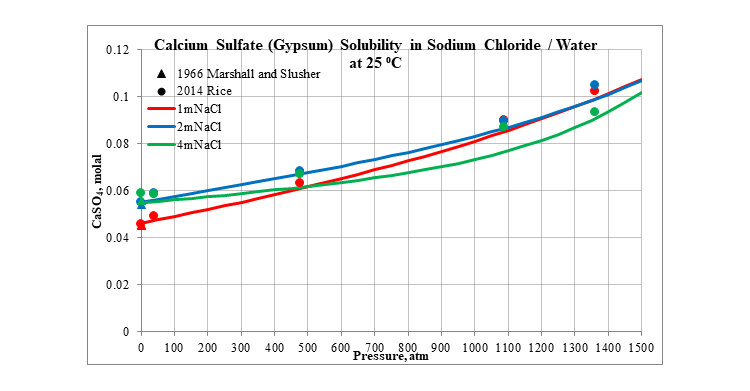
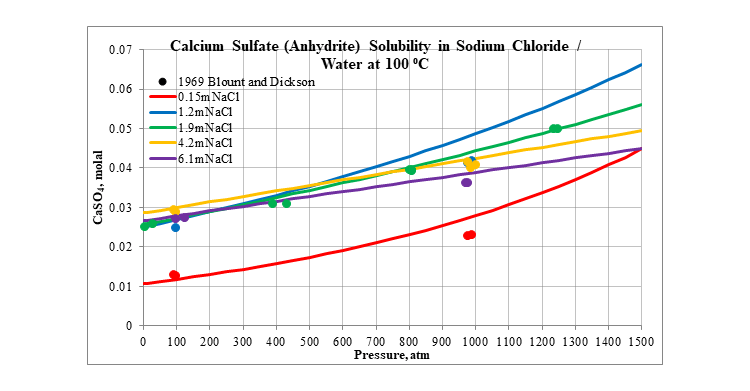
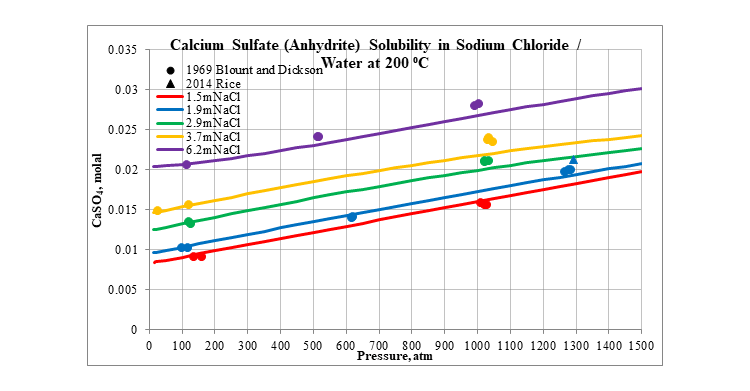
Finally, the next three plots show the effect of pressure on the solubility of calcium sulfate in several different aqueous sodium chloride solutions. The first is for the solubility of gypsum at 25 °C. The next two are for the solubility of anhydrite at 100 and 200 °C. In all three plots the solubility slightly increases as pressure increases.
Barium Sulfate
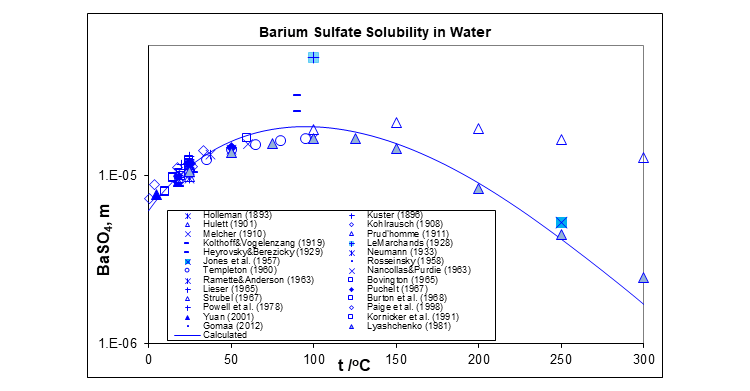
The plot below shows the solubility of barium sulfate in water at saturation pressure.
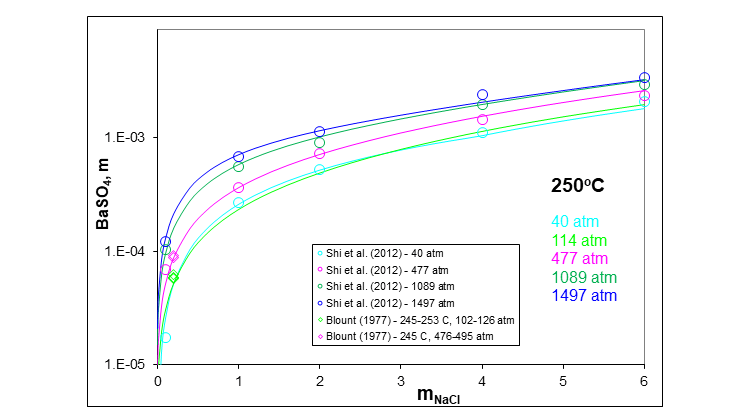
The next plot shows the effect that a typical salt, sodium chloride, has on the solubility of barium sulfate at 250 °C and at several pressures including high pressure. The solubility increases substantially at low sodium chloride concentrations. The increase is less at higher sodium chloride concentrations.
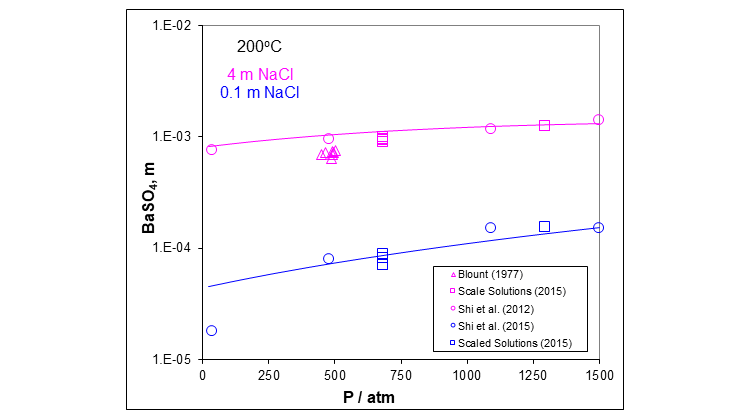
The next plot shows more clearly the effect of pressure on the solubility of barium sulfate in two different aqueous sodium chloride solutions at 200 °C. Again, the solubility slightly increases as pressure increases.
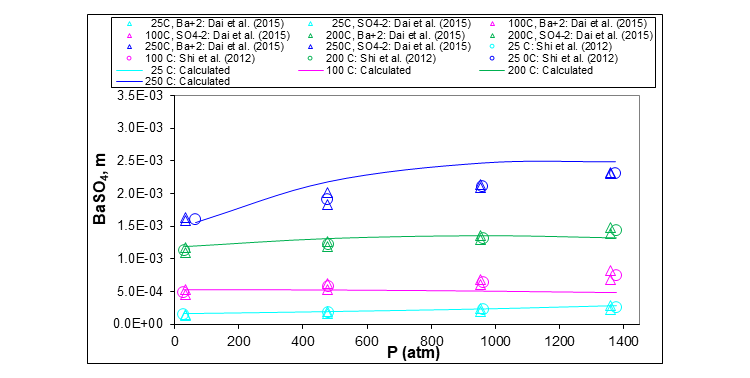
Finally, the last plot shows the effect of pressure on the solubility of barium sulfate in an aqueous solution containing sodium, potassium, magnesium and calcium chlorides. Four isotherms are included: 25, 100, 200 and 250 °C.
Summary
The diagrams given above show that the MSE model can accurately predict the solubility of calcium carbonate, gypsum, anhydrite and barium sulfate over a wide range of temperature, pressure and salt compositions, including HPHT conditions. Additional solubility plots for these scales, especially for many other aqueous salt solutions, are available from OLI. Also, additional information is available in two references (3,4).
The OLI System’s thermodynamic property package, which implements the MSE model with the capability of scale prediction is available in OLI Studio V10 and OLI Flowsheet ESP V10.
Contact OLI at https:/www.olisystems.com/contact for more information or to schedule a meeting with an OLI expert.
References
(1) Wang P., “Predicting “Exotic” Mineral Scaling in High-Temperature, High-Pressure Oil and Gas Environments Using the OLI Simulation Platform”, Linkedln, 2020.
(2) Wang P., Anderko A., Young R. D., “A Speciation – Based Model for Mixed – Solvent Electrolyte Systems”, Fluid Phase Equilibria, 203, (1-2), 141-176, 2002.
(3) Anderko A., Wang P., Springer R. D., Lencka M. M., Kosinski J. J., “Prediction of Mineral Scaling in Oil and Gas Production Using a Comprehensive Thermodynamic Model”, NACE Corrosion 2010 Paper 10129, 2010.
(4) Lencka M. M., Springer R. D., Wang P., Anderko A., “Modeling Mineral Scaling in Oil and Gas Environments up to Ultra High Pressures and Temperatures”, NACE Corrosion 2018 Paper 10828, 2018.


