


What is oil field scaling and the associated risks?
One of the premier issues in the oil and gas industry is scale deposition which occurs due to the changes in process conditions, such as pressure and temperature changes, dissolved gases, or incompatibility between mixing waters, resulting from waterflooding processes and chemical treatment operations that are applied to maintain sustainable hydrocarbon production at oil, gas, or gas condensate fields. Scale deposition in the formation pores restricts the flow of fluid through the formation of a thick layer in the wellbore tubular, which reduces the diameter of the production tubing and chokes the production from the reservoir. It can further cause formation damage in the reservoir resulting in energy leak, accelerated corrosion, and premature failure of downhole equipment, which can influence the safety of production and the economic benefit of the petroleum industry. The effect of scale can be dramatic and immediate, with a fall in the production capacity to zero in a few hours, and the treatment cost can be massive.
What are the commonly occurring oil field scales?
A scale deposit may occur as single mineral phases, but more commonly, it is a combination of different elements. The most common oilfield scales are sulfates such as CaSO4 (anhydrite, gypsum), BaSO4 (barite), SrSO4 (celestite), and CaCO3 (calcite). Other less common scales such as iron oxides, iron sulfides, iron carbonate, and calcium naphthenate scale from sour crudes have also been reported. The oilfield scale deposits can be classified into “pH-independent” and “pH-sensitive” scales. The scaling tendency of sulfates (calcium sulfate, barite, and celestite) and halite scales are not a strong function of brine pH, therefore are “pH-independent.” However, carbonates (calcite, dolomite, and siderite) and sulfide scales are acid-soluble, and the brine pH strongly influences their scaling tendencies. For pH-sensitive scales, the scale prediction is more complicated since issues that control the brine pH also affect their scaling tendencies.
How can OLI help in assessing/modeling scaling risk?
The precipitation of a mineral from an oversaturated solution involves two distinct stages: nucleation, a stage of solid formation via a reaction between the dissolved constituents, and crystal growth, a stage during which the solid grows via a reaction/ aggregation with the dissolved nucleus. The duration of this process is reasonably estimated by the “induction time,” which is classically defined as the time that passes from the creation of oversaturation with regard to a solid phase and the detection of that phase in the system due to precipitation.
OLI has developed a state-of-the-art theoretical tool by combining the classical nucleation theory (CNT) [1,2] with OLI’s proprietary Mixed-Solvent Electrolyte (MSE) [3,4] model to assess induction time. The strength of the MSE framework lies in its ability to model the solution chemistry of multi-component solutions over a wide range of solution conditions while explicitly considering prevailing hydrated and anhydrous solids in conjunction with aqueous speciation. Such an approach allows for accurate estimates of solubilities and scaling indexes for various solids, including the scale-forming ones. The scaling index is a key parameter and input to the CNT, which helps deduce the supersaturation level of a specific solid in the solution.
Supersaturation level and scaling index assessment
Figure 1a represents the calculated and experimental solubility of CaSO4 in the presence of NaCl at 25 °C, which elucidates a strong dependence of solubility on the background electrolyte (NaCl) concentration. At low NaCl concentrations (≤ 15 weight % of NaCl), solubility rises with gypsum (CaSO4.2H2O) forming the stable solid phase. However, at higher (between 15-25 weight %) NaCl concentrations, solubility decreases while the stable solid phase turns into anhydrite (CaSO4) and, beyond 27 weight % of NaCl, halite precipitates. The MSE model accurately captures the solubility and appropriately predicts the experimentally detected stable solid phases. Such precise solubility representation is essential to estimate the scaling index of the precipitating scaling solids accurately. Figure 1b represents the change in the gypsum scaling index, a representative of the supersaturation level, at 25 °C as a function of NaCl concentration. An increase in NaCl concentration in the solution decreases the solubility of CaSO4 at high NaCl concentrations, and hence the scaling index rises.
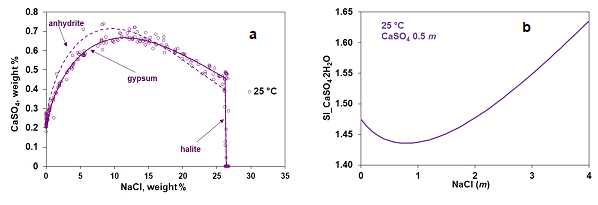
Figure 1 (a) Experimental and calculated solubility of CaSO4 in the presence of varying amount of NaCl at 25 °C along with the precipitating solid phases (b) Calculated scaling index of gypsum (CaSO4.2H2O) as a function of NaCl concentration at 25 °C
Induction time assessment for scaling solids
While MSE assesses scaling risk based on the scaling index, CNT provides kinetic information, i.e., an estimate of induction time, based on the continuum thermodynamic treatment of clusters. Figure 2 presents the logarithm of the induction time (in seconds) related to gypsum as a function of the inverse square of the scaling index, which changes depending on the solution condition. Each of the induction time curves is subdivided into two linear regions: the one closer to equilibrium (higher values of SI-2) is assumed to be dominated by heterogeneous nucleation, whereas the one further from equilibrium (lower values of SI-2) by homogeneous nucleation. The homogeneous nucleation occurs in the bulk solution and the heterogeneous nucleation proceeds on existing surfaces (e.g., those of solid particulate impurities, existing crystal structures, and surfaces). Based on Figure 2, it can be deduced that induction time decreases exponentially with the increase in the saturation level of the solid (gypsum) in the solution and has a strong dependence on temperature. The CNT+MSE framework provides an excellent representation of the experimental induction time data for gypsum.
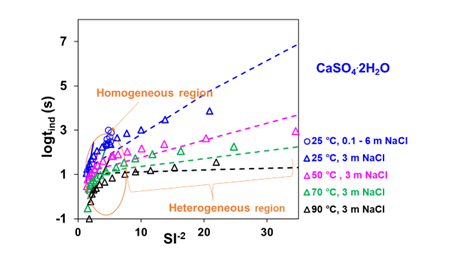
Figure 2. Calculated and experimental induction times related to the gypsum (CaSO4.2H2O) in the CaSO4-NaCl solution at 25, 50, 70, and 90 °C. Symbols are experimental data, whereas lines represent MSE+CNT model calculations
What are different scaling mitigation techniques?
Conventional scale inhibitors are hydrophilic; that is, they dissolve in water. However, in the case of down-hole squeezing, it is desirable that the scale inhibitor is adsorbed on the rock to avoid washing out the chemical before acting as desired. Inorganic phosphates, organo-phosphorous compounds, and organic polymers are identified as the most common scaling inhibitors. For example, PPCA (polyphosphono carboxylic acid) and DTPMP (diethylenetriamine penta (methylene phosphonic acid)) are the two common commercial-scale inhibitors used in the oil and gas industry.
How can OLI help in scaling inhibition/ mitigation?
Solution chemistry of the inhibitors
Explicit modeling of the solution chemistry of the inhibitor is essential in assessing its effectiveness in the presence and absence of other complex-forming cations. OLI’s MSE model has been used to model the solution behavior of several phosphonates and carboxylic acid-based inhibitors, commonly used in industry for preventing the formation of sulfate and carbonate scales. For example, Figure 3 presents the titration curves for DTPMP in the 1 M NaCl medium at 25-90 °C, where NaOH has been used as the titrant. The model for the DTPMP has been developed while considering all the relevant species, which in turn allows us to accurately represent the titration curve with transitions in the solution pH occurring due to the changes in the solution speciation.
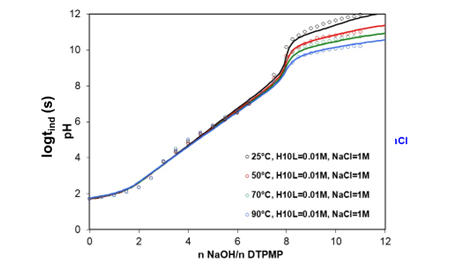
Figure 3. Titration curve for DTPMP at 25, 50, 70, and 90 °C. Symbols are experimental data, whereas solid lines represent the MSE model calculations
Effect of the inhibitor on the scaling induction time
The scaling inhibitors prevent or delay crystal nucleation and disrupt crystal growth by getting adsorbed on the active sites of the nuclei. While the application of the CNT for scale-forming minerals in the absence of inhibitors is well established, the development of the theoretical formulation in the presence of inhibitors is still evolving. We have devised a simple approximation of the CNT to appropriately take into account the changes in the surface tension of the solid due to the adsorption of the inhibitor on the surface, which can be extended to the multiple inhibitors. Figure 4 represents the effect of DTPMP on delaying the induction time of gypsum at different dosage levels at 25, 50, and 75 °C. The theory provides an excellent representation of the experimental data as it predicts that 2.5 ppm DTPMP treatment will increase the induction time of gypsum more than ten times.
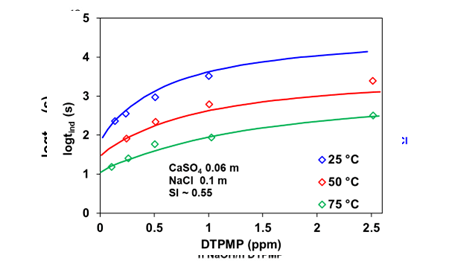
Figure 4. Induction time for gypsum scale at different DTPMP dosage levels at 25. 50 and 75°C. Symbols are experimental data, whereas solid lines represent the MSE model calculations
What tools are available for predicting scaling risk and inhibition study?
The OLI System’s thermodynamic and scaling kinetics property package, which is based on the MSE model, is available in OLI Studio V11.5 and OLI Flowsheet ESP V11.5.V11.5 contains four commonly occuring oilfield scales: barite, celestite, gypsum, calcite along with 1-hydroxyethylidene-1,1-diphosphonic acid (HEDP), amino tris (methylenephosphonic acid) (NTMP), diethylenetriamine penta (methylene phosphonic acid) DTPMP, ethylenediamine tetra (methylene phosphonic acid) (EDTPMP), and polymaleic acid (PMA) inhibitors.
For more updates on this project and the OLI System’s thermodynamic property package, contact OLI here for more information or to schedule a meeting with an OLI expert.
References
[1] A.E. Nielsen, Kristall und Technik 4 (1969) 17-38.
[2] O. Söhnel, J.W. Mullin, Journal of colloid and interface science 123 (1988) 43-50.
[3] P. Wang, R.D. Springer, A. Anderko, R.D. Young, Fluid Phase Equilib. 222 (2004) 11-17.
[4] P. Wang, A. Anderko, R.D. Young, Fluid Phase Equilib. 203 (2002) 141-176.