


Research has shown that strong acids such as sulfuric and nitric acids may be produced as a result of reactions between impurities during CO2 transport within carbon capture, utilization and storage (CCUS) systems. This is possible even when today’s impurity specifications and recommendations are followed. Strong acids are corrosive to carbon steel, which is a very common construction material for CO2 transport pipelines. The behavior of impurities in CO2 transportation is very complex. To study the formation of corrosive species in CO2 transportation, it is essential to have a thermodynamic model that simultaneously predicts phase and chemical (both acid-base and redox) equilibria not only in the water-rich phase but also in the CO2-rich phase.
Thermodynamic Model
A thermodynamic model, based on the OLI Mixed-Solvent Electrolyte (MSE) framework, was developed for predicting the thermodynamic behaviour of acid – CO2 mixtures over the whole range of temperatures, pressures, and compositions that are of practical interest. Experimental data from the literature and from the Institute for Energy Technology (IFE) was used. The model is applicable to multicomponent mixtures and includes the behaviour of other impurities (such as NOx, SOx, H2O, H2S, and O2). Furthermore, it is capable of simulating reactions between the impurity species within both the H2O-rich and CO2-rich phases. These capabilities are unique to CO2 transportation systems and have not been previously considered in the industry or the research community. Further details of the MSE model are available in reference 1.
Thermodynamic modelling was accompanied by an extensive revision of the algorithm for computing phase and chemical equilibria, which made it possible to simultaneously simulate redox and liquid-liquid-solid equilibria in primarily nonaqueous phases. The MSE thermodynamic model provides equilibrium calculations. The calculations do not consider any possible kinetic limitations of the reactions. Therefore, the predictions can be considered a worst-case scenario when the reactions between the impurities lead to the formation of highly corrosive phases. The results of thermodynamic modeling and the improvements in the equilibrium computation algorithm have been implemented in version 11.5 of the OLI software.
CO2 Transportation App
A new cloud solution has been created to make it dramatically easier to predict the behavior of impurities in CO2 without compromising the rigor of the thermodynamic model. Users do not need expertise in electrolyte modeling and process simulation to use this tool. It eliminates the need to install the software and the need to learn the OLI Studio Stream Analyzer or Flowsheet: ESP software.
The CO2 Transportation App has three screens – input, simplified output, and detailed output. The input screen for a typical condition is shown below. The input includes:
- Temperature in °C
- Pressure in atm
- Component amounts in moles
In general, it is convenient to work with ppm mole units when specifying the compositions. This can be achieved by specifying 106 mol CO2. Then, the impurity concentrations will be approximately ppm mole. The current version of the CO2 Transportation App supports the following impurities:
- H2O
- O2
- H2S
- SO2
- NO2
It should be noted that it is not necessary to define the chemistry details such as including the second liquid phase or selecting the redox subsystems. After running the calculations, the calculated total amounts of the species are shown on the right-hand side of the input screen. This allows the user to quickly check what species are formed due to reactions between the impurities.
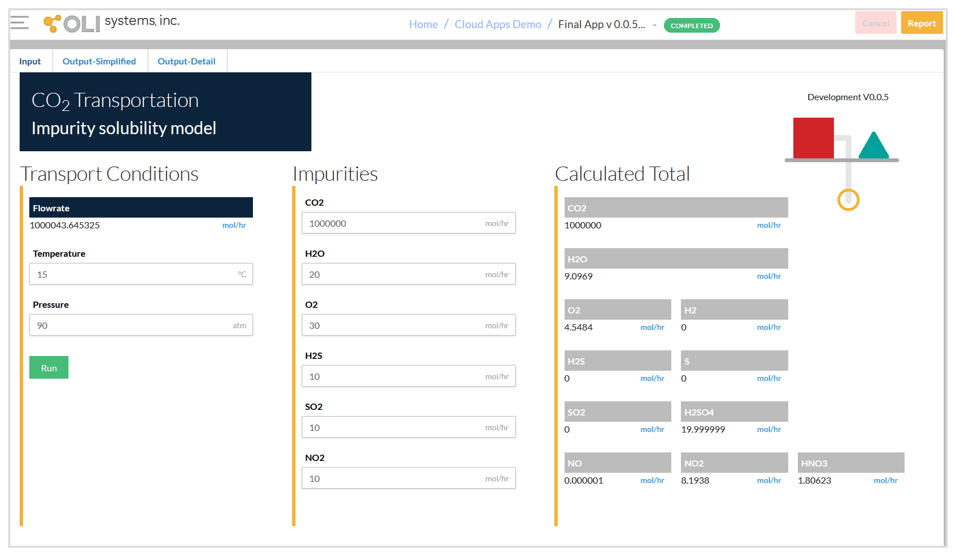
Input screen and calculated total amounts.
The second screen of the App given below shows the simplified output. This screen indicates which phases are predicted. There are four possible phases – vapor phase, liquid phase, acid phase and solids. The vapor phase and liquid phase are both CO2-rich phases. If CO2 is at supercritical conditions, it assigned to either the vapor or liquid phase, depending on temperature and pressure. Usually, either the vapor phase or the liquid phase will be predicted.
The most important phases to look for are the acid phase and solids. The acid phase is the aqueous phase that may contain H2SO4 and/or HNO3. The presence of this phase indicates the possibility of corrosion. The solid phase is limited to elemental sulfur and ice. Since the presence of either of these phases indicates the possibility of operational problems in CO2 transportation, a red symbol appears above them if they are present.
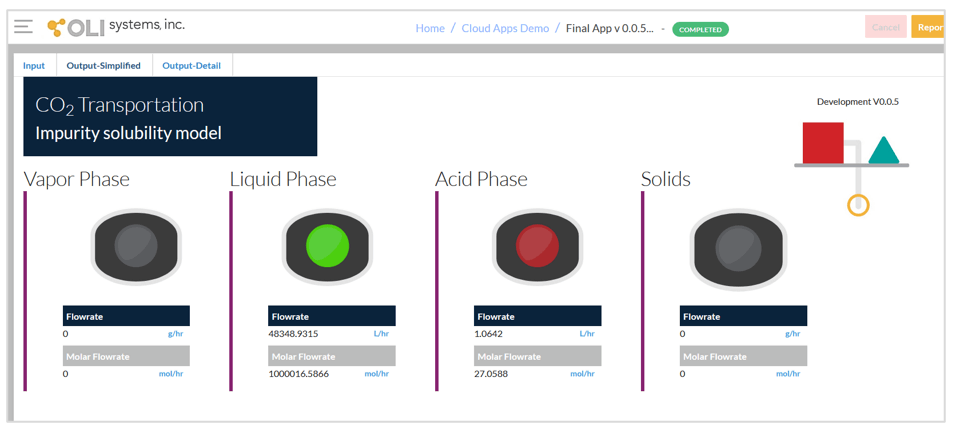
Simplified output screen.
The third screen given below shows detailed output from the calculations. In this screen, the predicted numbers of moles are shown in the four phases. When using 106 mol CO2 in the input, the displayed numbers are equivalent to ppm mol relative to the whole mixture. H2SO4, HNO3, and S may be dissolved in the CO2-rich phases according to their solubility. If the acids are dissolved in CO2, they are not corrosive. It is possible that all acids and solids that are formed in the reactions may be in the CO2-rich phase if the original amounts of impurities are not large.
It should be noted that the components that are present in the acid phase are speciated, i.e., they may exist in the form of both molecules and ions. For example, the reported H2SO4 in the acid phase combines the HSO4–, SO42-, H2SO40, and SO3 species. If there is interest in detailed speciation in the acid-containing phase, it is necessary to switch to the desktop software.
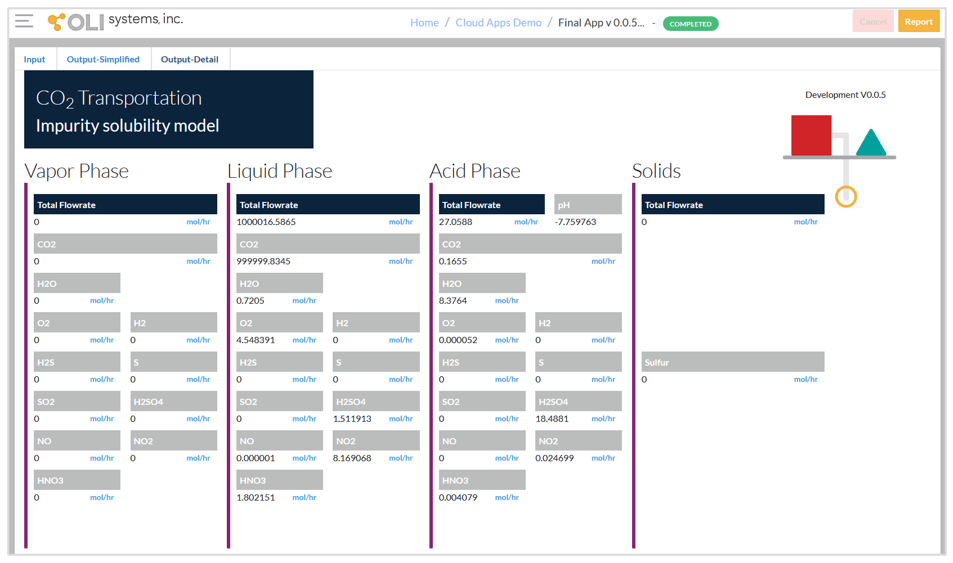
Detailed output screen.
OLI Studio
The calculations in the App can also be perfomred in Stream Analyzer in OLI Studio. One advantage of Stream Analyzer is that surveys can be run, and the results can be plotted. However, unlike the CO2 transportation App, the chemistry model must be defined. This is done as follows:
- Select the MSE thermodynamic framework. No other databanks are needed.
- Include the second liquid phase.
- Include redox chemistry. Select only the oxidation states for nitrogen and sulfur as shown below:
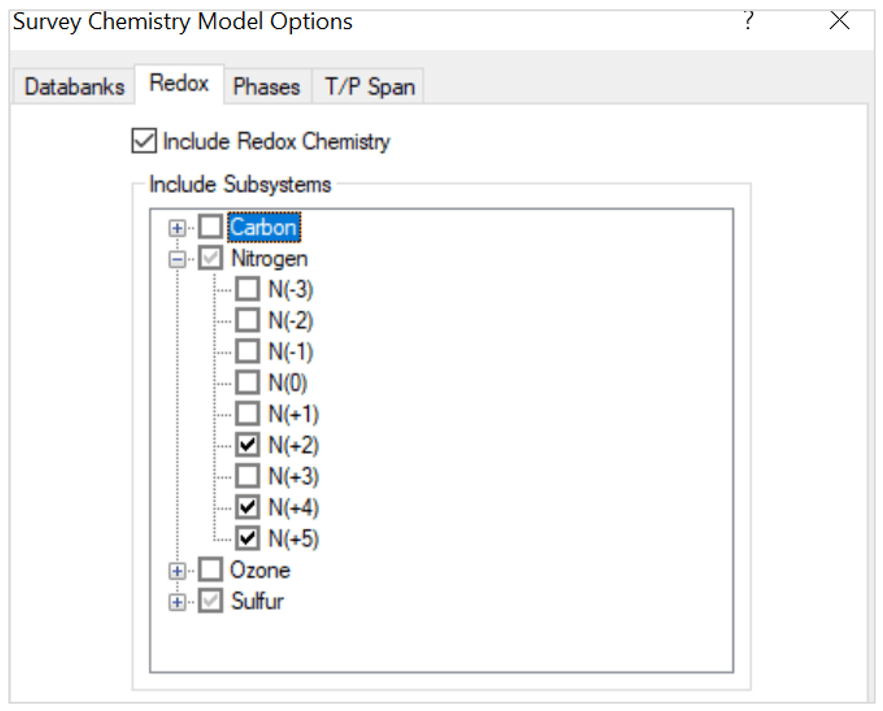
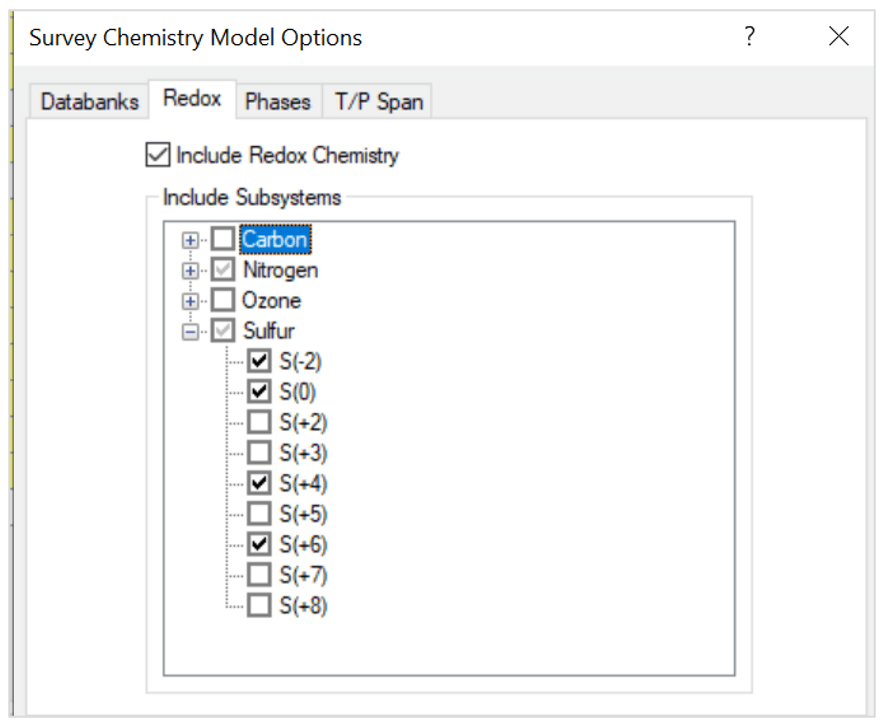
Note that the oxidation states represent these species:
- S(-2) – H2S
- S(0) – S
- S(+4) – SO2
- S(+6) – H2SO4
- N(+2) – NO
- N(+4) – NO2
- N(+5) – HNO3
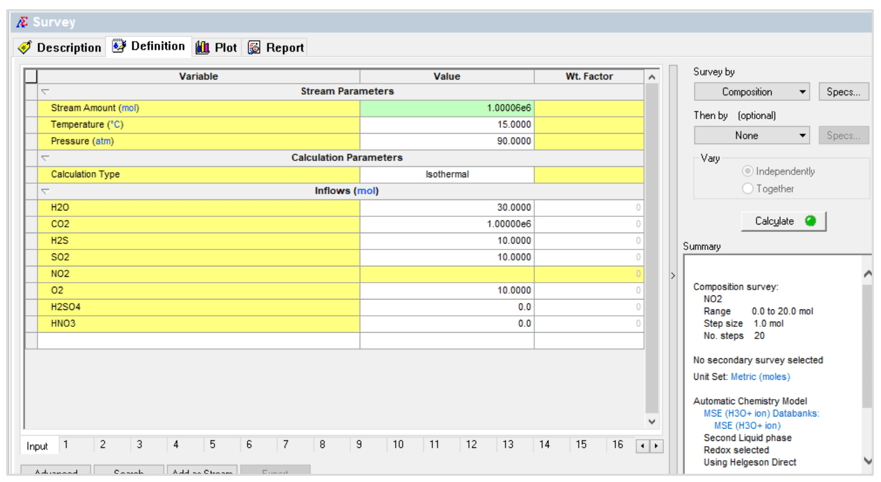
The first case is a composition survey. The NO2 composition is varied as shown below:
This produces the following plot:
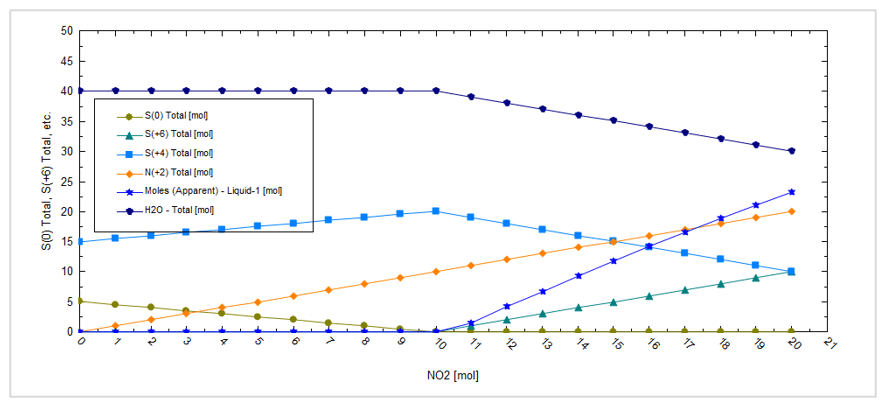
At low NO2 amounts, sulfur, S(0), is formed but it dissolves in the CO2 phase. At higher NO2 amounts, sulfuric acid, S(+6), is formed and creates a separate liquid acid phase, Liquid-1.
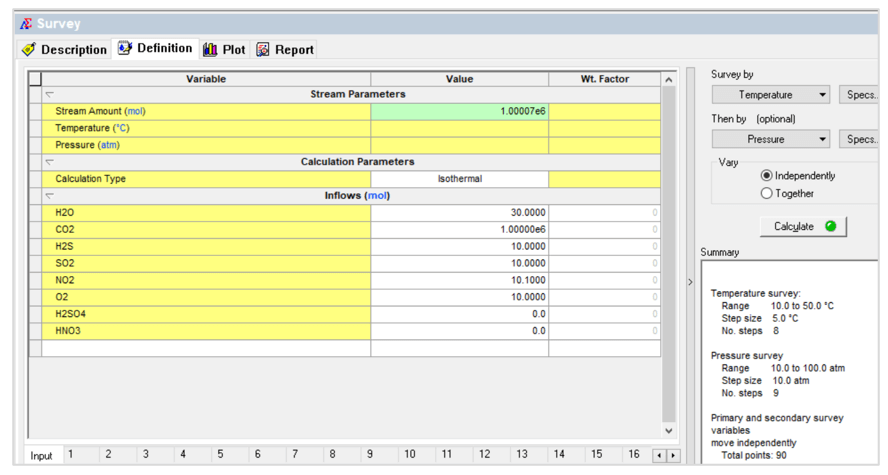
The second case is a temperature – pressure survey shown below:
This gives the following contour plot:
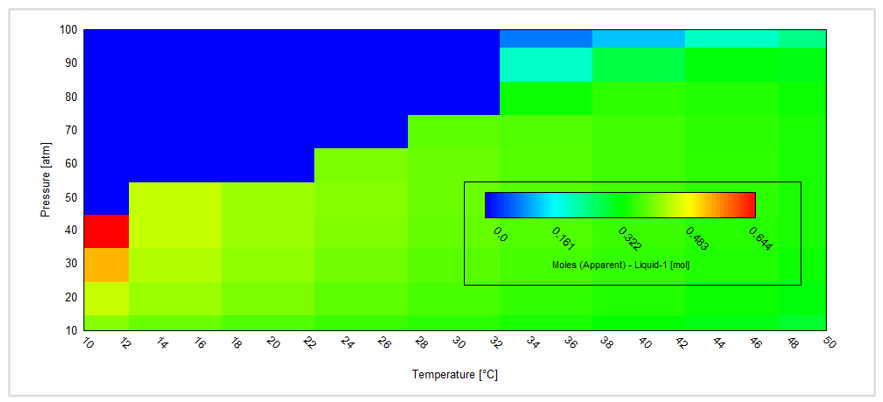
This plot shows the amount of the separate liquid acid phase. For a given composition this is a very convenient way to predict how temperature and/or pressure changes (for example flowing in a pipeline) may result in the formation of a separate liquid acid phase.
References
1) Morland B. H., Tadesse A., Svenningsen G., Springer R. D., Anderko A., “Nitric and Sulfuric Acid Solubility in Dense Phase CO2”, Industrial and Engineering Chemistry Research, 58, (51), 22924-22933, 2019.