


Air pollution and climate change are closely related and it is imperative to reduce the pollution caused by gaseous emission from the combustion of fossil fuels. Polluted air contains unacceptable levels of harmful substances, such as carbon dioxide (CO2), carbon monoxide (CO), nitrogen oxides (NOx) including (NO2, NO, N2O), sulfur oxides (SOx) (SO2, SO3), particulate matter (PM), and volatile organic compounds (VOCs) [1]. CO2 is a greenhouse gas and has adverse environmental impacts, that lead to global warming and climate change.
SOx and NOx are called acidic gases owing to their contribution towards acid rain which is harmful to plants and marine organisms when H2O, O2, and other substances in the atmosphere react together. Acid rain, global warming, the greenhouse effect, and climate change have an important ecological impact on air pollution for human survival.
On the other side, CO2 capture and storage (CCS) seeks to capture CO2 from large emission sources and safely store it in underground reservoirs or use it for enhanced oil recovery operations. CCS is an emerging technology to capture CO2 and reduce emissions to attain less than 2 ℃ temperature increase above pre-industrial Earth temperatures [2]. The quality of CO2 captured from power plants or industrial installations depends on several factors, like the nature of the fossil combustible involved, the process used for combustion and capture, as well as the possible use of further treatments. Depending on these factors, the CO2 stream will contain variable amounts of gas contaminants, such as CO, N2, O2, Ar, SOx and NOx. The mixture of gases may have significantly different thermophysical properties as compared to a pure CO2. This may have impacts on the different stages of the CCS chain: capture, transportation, compression, injection and storage. Extensive understanding of pressure-temperature-composition mechanism is essential to develop appropriate conditioning, transport and storage procedures as CO2 will need to be processed in liquid forms at all times throughout the chain. Therefore, it is necessary to know the thermodynamics behavior of CO2-containinant mixtures in order to optimize carbon dioxide capture and storage solutions.
Phase equilibria between CO2 and contaminants
OLI software V11.5 uses its proprietary Mixed Solvent Electrolyte (MSE) [3] thermodynamic model, which includes not only comprehensive equilibrium properties of CO2 or contaminants (NOx, SOx, N2, H2, O2, CH4 and so on) with water, but also the phase equilibria between CO2 and contaminants over wide range of temperatures and pressures.
The software provides the thermodynamic underpinning for modeling the thermodynamic behavior of CO2 with toxic gases such as SO2 (considering the scarcity of experimental data because of toxicity of sulfur dioxide and difficulty and cost of experimentation). It is a dramatic improvement over an alternative, experimental-based design.
SO2 solubility in water
One of effective methods to reduce SO2 emissions is co-injection of SO2 with CO2 into deep geologic formations. However, because SO2 is more soluble in water, co-sequestration with CO2 into the reservoir can accelerate the reaction of water with rock and increase the leakage risk. Therefore, knowledge of solubility of SO2 in water covering a wide range of temperature and pressure is essential to understand the interactions and alterations in the reservoir during the co-injection of SO2 with CO2.
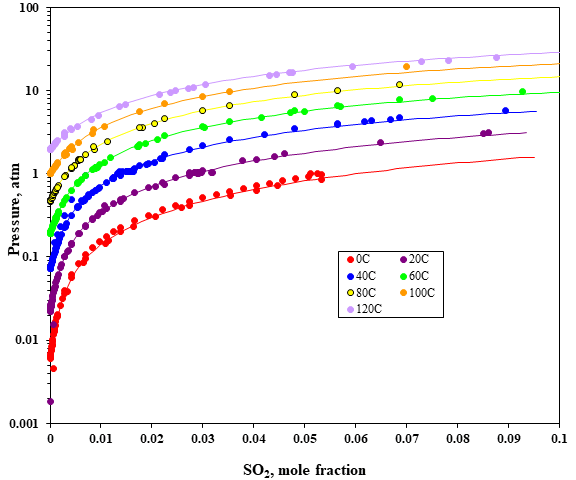
Fig. 1 Sulfur dioxide solubility in water
It is well known that sulfur dioxide in water dissociates into ions forming a weak electrolyte. The solution consists of hydrated SO2 as well as sulfite (SO32-) and bisulfite (HSO3–). The OLI MSE thermodynamic framework, which calculates long-range electrostatic interactions, short-range intermolecular interactions as well as specific ionic interactions for all the possible species in the aqueous solution, can accurately predict the solubility of SO2 in water for high pressures and temperatures. Figure 1 shows that the solubility of SO2 in water is mainly affected by the pressure, and the solubility increases with the increase of pressure and decreases with the increase of temperature. Results of modeling SO2 solubilities in water are in good agreement with the experimental data.
Thermodynamic behavior of the CO2 + SO2 mixture
Some of these CO2-contaminant mixtures, such as CO2 + O2 and CO2 + N2, have been studied over a large range of pressure and temperature. In the case of CO2 + SO2 mixture, thermodynamic data are very scarce because of toxicity and high cost of experiment.
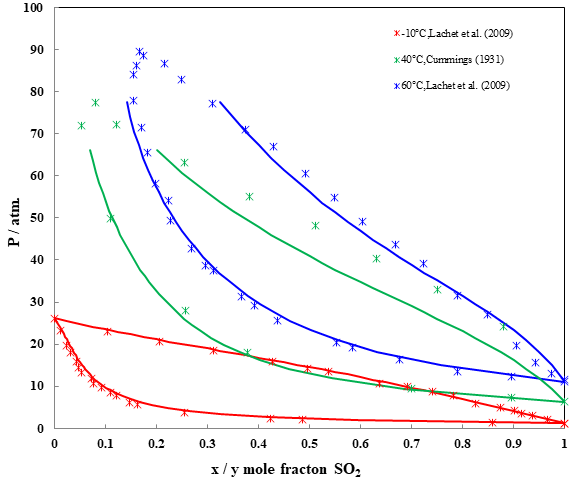
Fig. 2 Phase diagrams for the CO2 + SO2 mixture
Figure 2 shows the (P,x,y) phase diagrams for the CO2 + SO2 mixture at three different temperatures. The lowest temperature, -10 °C, is below the critical temperature of CO2 (Tc=304.21 K), which explains why the phase diagram ends at the vapor pressure of pure CO2 at this temperature. The prediction matches the experimental data very well. The other two temperatures are above the critical temperature of CO2, and the MSE model shows the same behavior for this binary system except around liquid-vapor critical range.
N2O and NO solubilities in water
Nitrous oxide (N2O) is a strong greenhouse gas with 298-fold higher global warming potential per mole than that of carbon dioxide. N2O is also a catalyst of ozone depletion in the stratosphere. The contribution of N2O emissions to global warming and ozone depletion will increase because N2O is not as strictly regulated as are CO2 and halocarbon compounds. Nitrous oxide is highly soluble in water, as shown in figure 3, with its solubility increasing as temperature decreases.
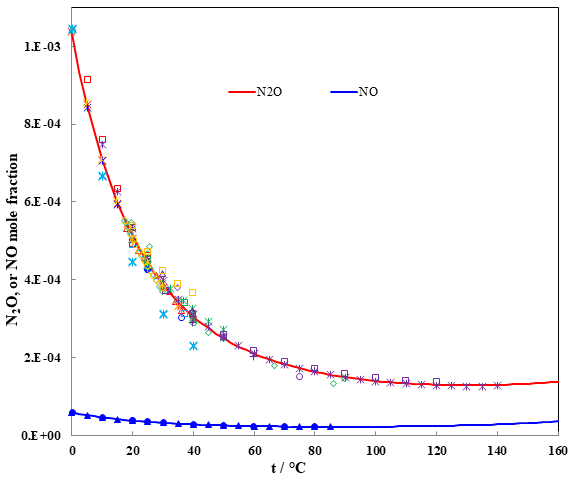
Fig. 3 N2O and NO solubilities in water with PN2O = 1 atm. or PNO = 1 atm.
The solubility data for NO are sparse and much less comparison with the solubility data of N2O in water. The solubility trend is the same as shown in figure 3 when temperature increases. Knowing all these solubilities is essential to predict the physical-chemical evolution of the storage and the possible chemical reactions occurring between the fluids and minerals.
Equilibrium of CO2 + N2O and CO2 + NO mixtures
Due to the strong similarities between carbon dioxide and nitrous oxide (Tc(CO2) = 304.21 K; Tc(N2O) = 309.57 K; Pc(CO2) = 7.38 MPa; Pc(N2O) = 7.24 MPa), the two-phase region is very narrow and very flat at all studied temperatures. All these temperatures are below the critical temperatures of both CO2 and N2O, thus none of the phase diagrams exhibits a critical point.
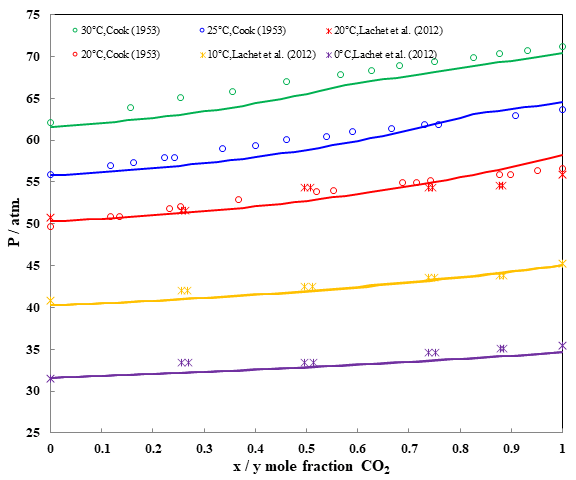
Fig. 4 Pressure – composition diagram of binary system CO2 + N2O
In figure 4, differences between the compositions of the liquid and the vapor phases at equilibrium are very small which means that the system may be azeotropic over the whole range of composition. A good agreement between experimental and prediction is obtained at 5 different temperatures.
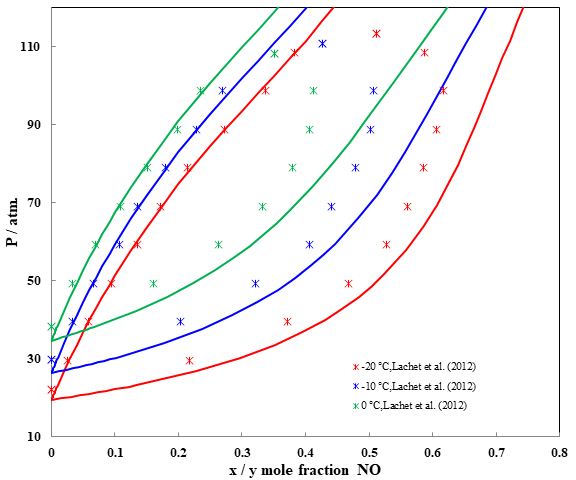
Fig. 5 Pressure – composition diagram for binary system CO2 + NO
The phase diagrams of the CO2 + NO binary have been calculated at three different temperatures in figure 5. As expected, the extent of the two-phase region decreases as the temperature increases. The three temperatures are below the critical temperature of carbon dioxide and above the critical temperature of nitric oxide (Tc = 180.15 K), thus all phase diagrams exhibit a critical point. The OLI simulations match very well in aqueous phase, and overpredict dew point pressures close to the critical point.
Apart from the solubilities of NOx / SOx -containing systems as well as equilibria between CO2 with the contaminants, the MSE model incorporated in the OLI Software Platform V11.5 can also calculate other thermodynamics properties such as liquid-liquid equilibria and caloric properties (heat capacities, heat of dilution) which are used to analyze and optimize streams in processes.
Finally, OLI Corrosion Analyzer V11.5 is well suited for simulating CCS, can help to choose the appropriate material for construction and accurately predict the formation of corrosive components and understand their safe limits, corrosion rates, and the conditions that can lead to failure.
What tools are available for environmental impurity of SOx / NOx?
OLI Systems’ simulation technology, which is based on the MSE model, is available in OLI Studio V11.5, OLI Flowsheet ESP V11.5, OLI Cloud APIs and other OLI software products.
Contact OLI for more information or to schedule a meeting with an OLI expert.
Reference
- Abdullah, A.; Ahmed, A.; Akhter, P.; Razzaq, A.; Zafar, M.; Hussain, M.; Shahzad, N.; Majeed, K.; Khurrum, S.; Saifullah M. A. B.; Park, Y. K.; “Bioenergy potential and thermochemical characterization of lignocellulosic biomass residues available in Pakistan”, Korean J. Chem. Eng. 37 (2020) 1899-1906.
- Munkejord, S.T.; Hammer, M.; Løvseth, S.W. “CO2 transport: Data and models-A review”. Appl. Energy 2016, 169, 499–523.
- Wang P., Anderko A., Young R. D., “A Speciation – Based Model for Mixed – Solvent Electrolyte Systems”, Fluid Phase Equilibria, 203, (1-2), 141-176, 2002.