


Introduction
Although the MSE framework provides accurate predictions of the properties of electrolyte systems, a weakness of MSE is its inability to reliably predict the phase equilibrium of hydrocarbon and hydrocarbon / light gas (carbon dioxide, hydrogen sulfide, and nitrogen) mixtures. This is true for high pressures as well as the critical region. In many instances it is also true for moderate pressures. MSESRK was developed to overcome this weakness. The models used by the three thermodynamic frameworks in the OLI software are shown below:
| Framework | Aqueous | MSESRK | MSE |
| Vapor Phase Model | SRK | SRK | SRK |
| 2nd Liquid Phase Model | SRK | SRK | MSE |
| Aqueous Phase Model | Bromley | MSE | MSE |
The MSESRK framework can be considered as a “halfway” implementation of MSE relative to the Aqueous framework. That is MSE only replaces Bromley for the aqueous phase model. This captures most of the benefits of MSE since it is a much superior aqueous phase model then Bromley. Note that for both Aqueous and MSESRK the SRK model is used for the vapor and 2nd liquid phases. SRK is a very reliable model for hydrocarbon and hydrocarbon / light gas mixtures. The MSE framework is the full implementation of MSE since it is also used for the 2nd liquid phase. While this has certain advantages (primarily for liquid-liquid calculations for electrolyte or ionic liquid systems and for electrolyte + organic mixtures such as those used in extraction equilibria) the main disadvantage is that MSE does not reliably predict the properties of liquid hydrocarbon mixtures.
MSESRK Guidelines
The main consideration in selecting MSESRK is the presence of hydrocarbons. MSESRK is intended to be used for mixtures that contains hydrocarbons that exist in a liquid or liquid-like (high pressure) phase. It is also intended for hydrocarbon mixtures that are in equilibrium with a water phase that can contain electrolytes. Typical applications generally include gas and oil production and, secondarily, some refinery and petrochemical processes. It can also be used for autoclaves. MSESRK can be used in the OLI Flowsheet program. Unfortunately, at the present time, it cannot be used to simulate hydrocarbon distillation columns.
MSESRK and MSE Comparison
The following sections compare MSESRK and MSE predictions to experimental data for several mixtures. Note that for hydrocarbon / hydrocarbon and hydrocarbon / light gas mixtures the MSESRK predictions are SRK predictions.
Hydrocarbon Mixtures
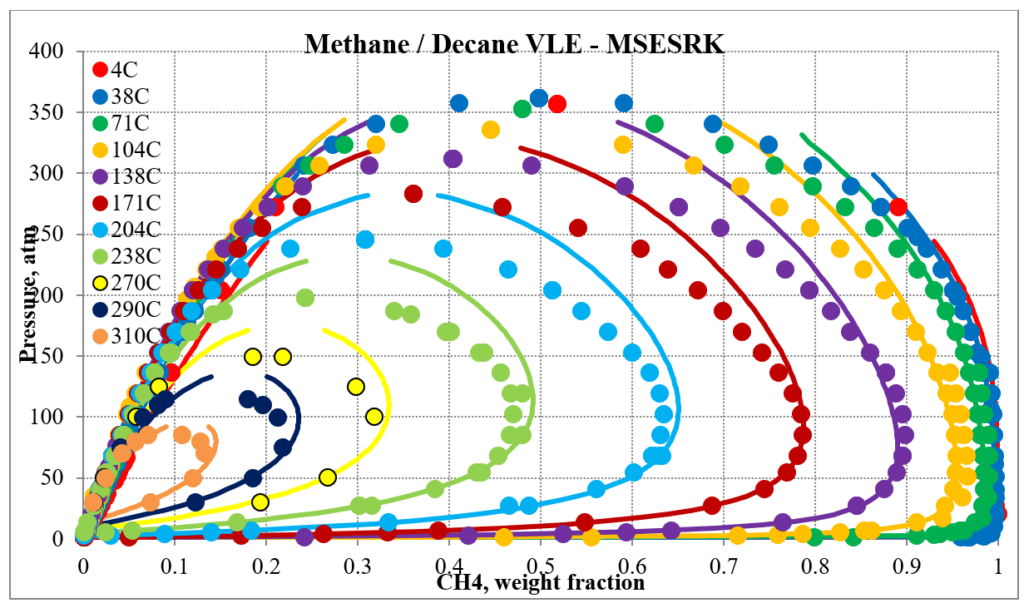
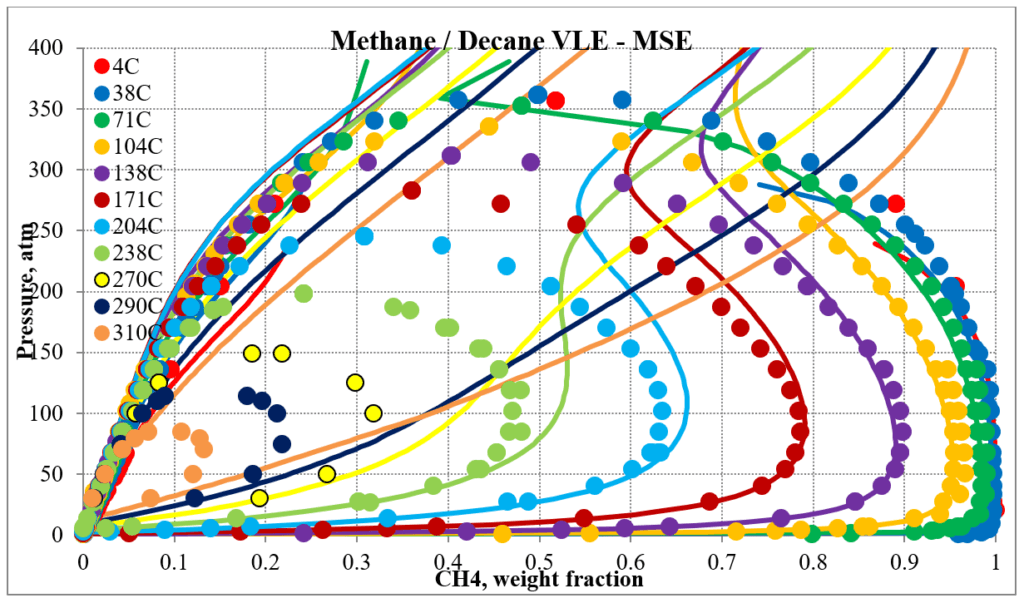
The two plots below show predictions for methane / n-decane experimental vapor – liquid equilibrium. The MSE predictions are very erratic at higher pressures and show two phase behavior well above the two-phase region. The MSESRK predictions are much more reliable except for very close to the critical region. Plots are similar for other methane / hydrocarbon mixtures.
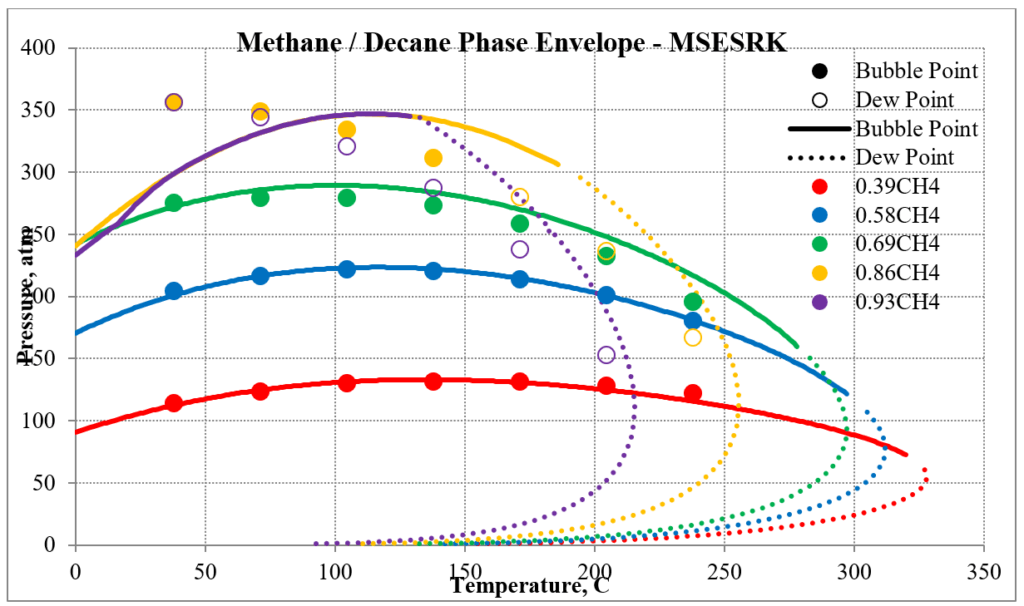
The next two plots show predictions of the phase envelopes for several methane / n-decane mixtures. The same comments given above also apply here.

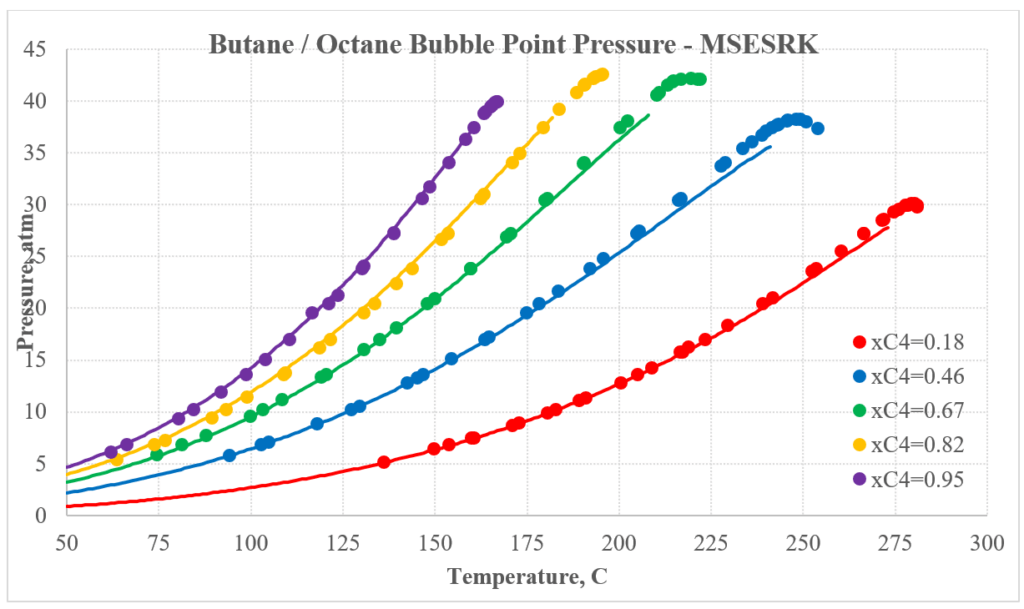
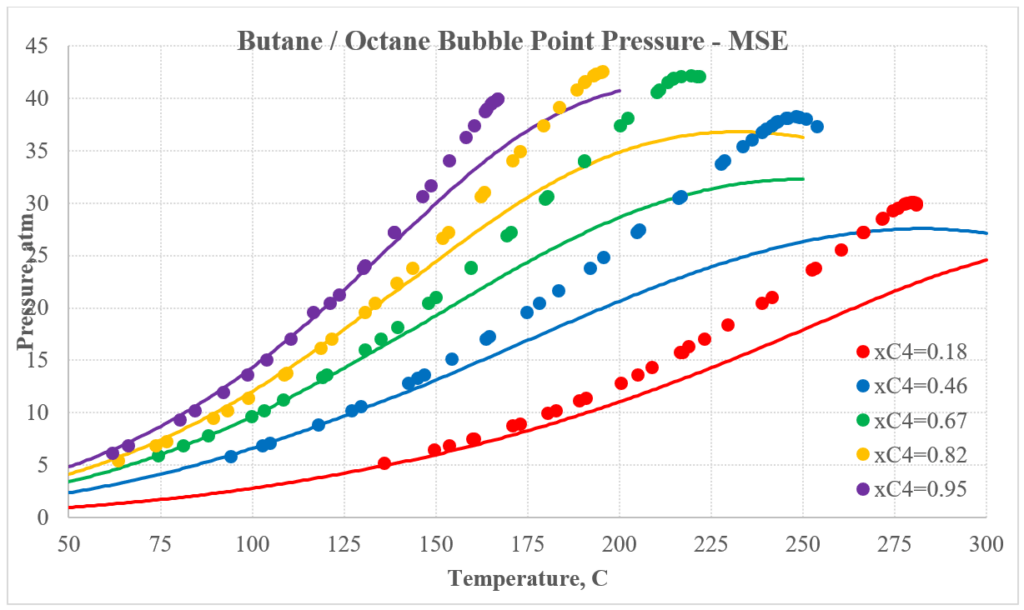
The next two plots show predictions for n-butane / n-octane experimental vapor-liquid equilibrium. Again, the MSESRK predictions are much better than the MSE predictions. Similar predictions are expected for most other hydrocarbon / hydrocarbon mixtures. Another advantage of MSESRK is that generally no additional binary parameters are needed for hydrocarbon / hydrocarbon mixtures. This is not the case for MSE.
Hydrocarbon / Light Gas Mixtures
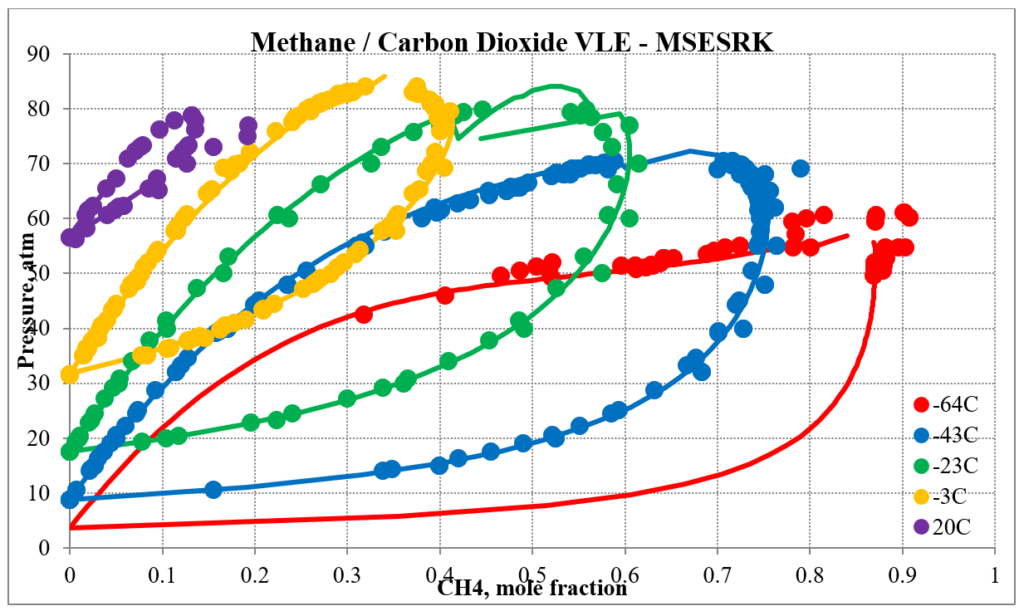
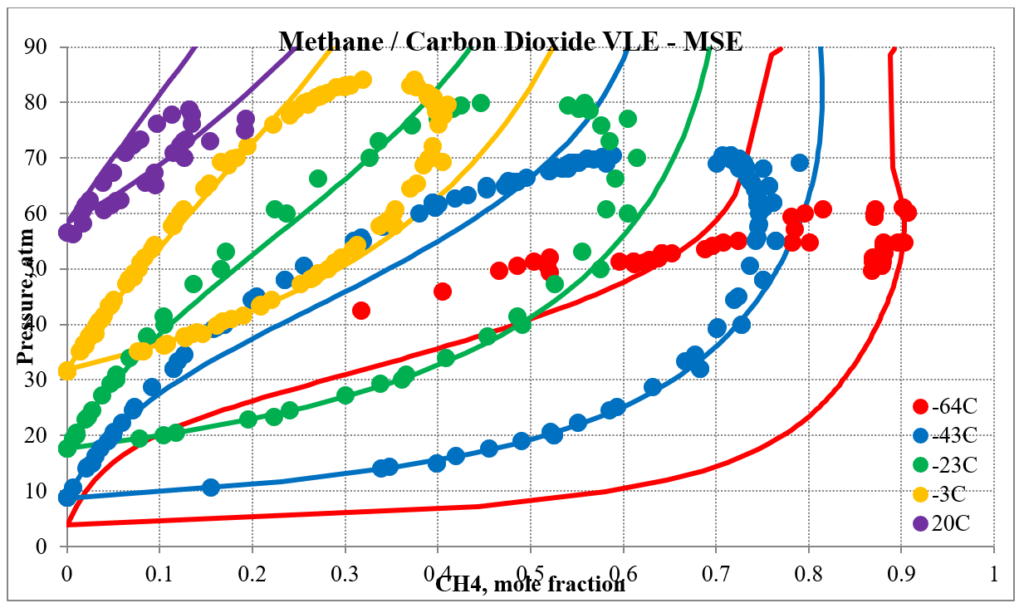
In addition to hydrocarbon mixtures MSESRK provides reliable predictions for mixtures that also contain light gases. The next two plots below show predictions for methane / carbon dioxide experimental vapor – liquid equilibrium. The MSESRK predictions are much more reliable than the MSE predictions.
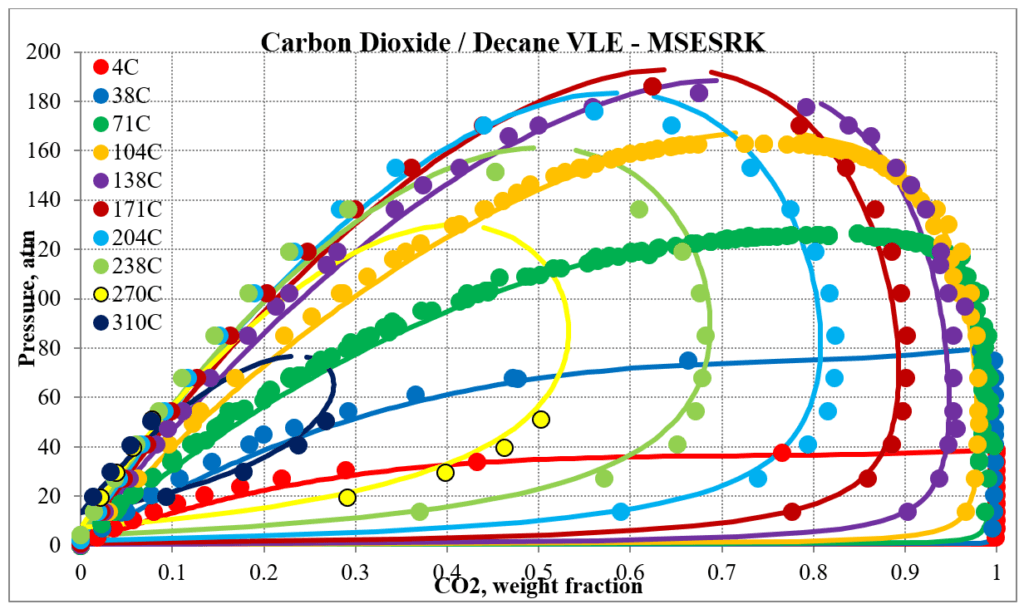
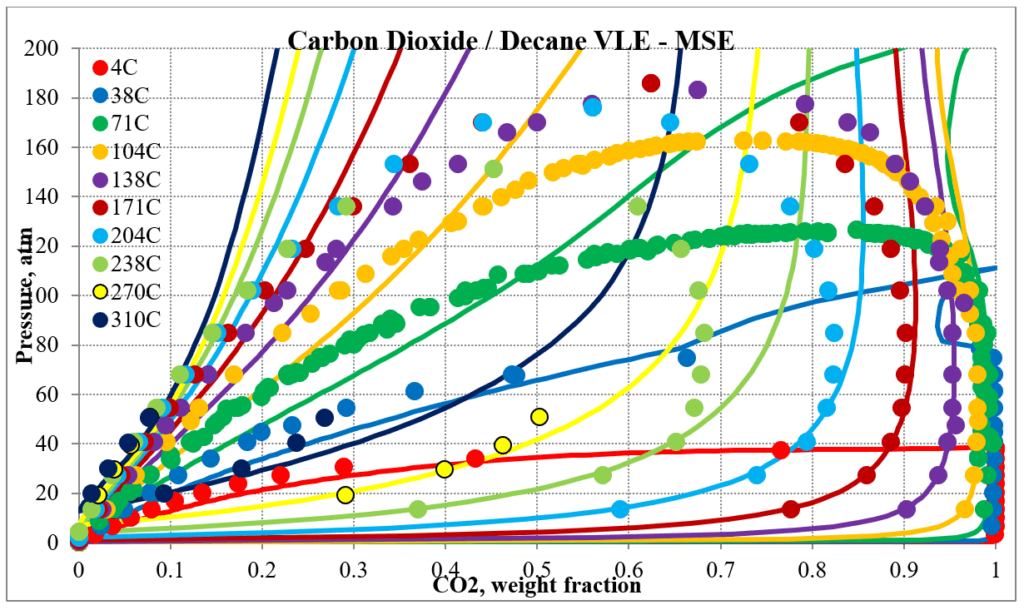
The next two plots below show predictions for carbon dioxide / n-decane experimental vapor – liquid equilibrium. The MSESRK and MSE predictions are like the methane / n-decane predictions with the MSE predictions having the same problems. Plots are similar for other carbon dioxide / hydrocarbon mixtures.
Hydrocarbon / Water Mixtures
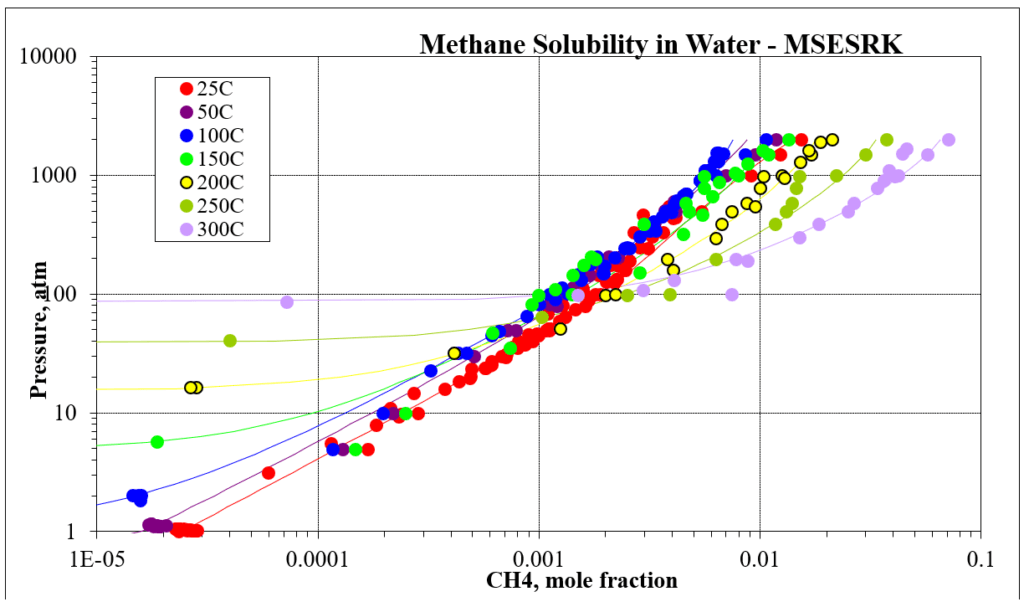
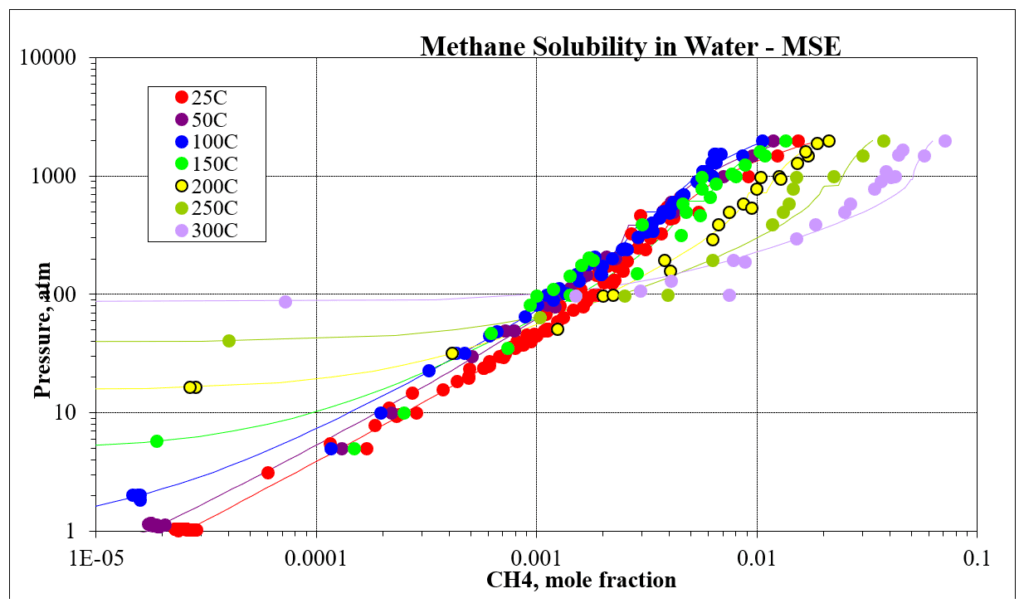
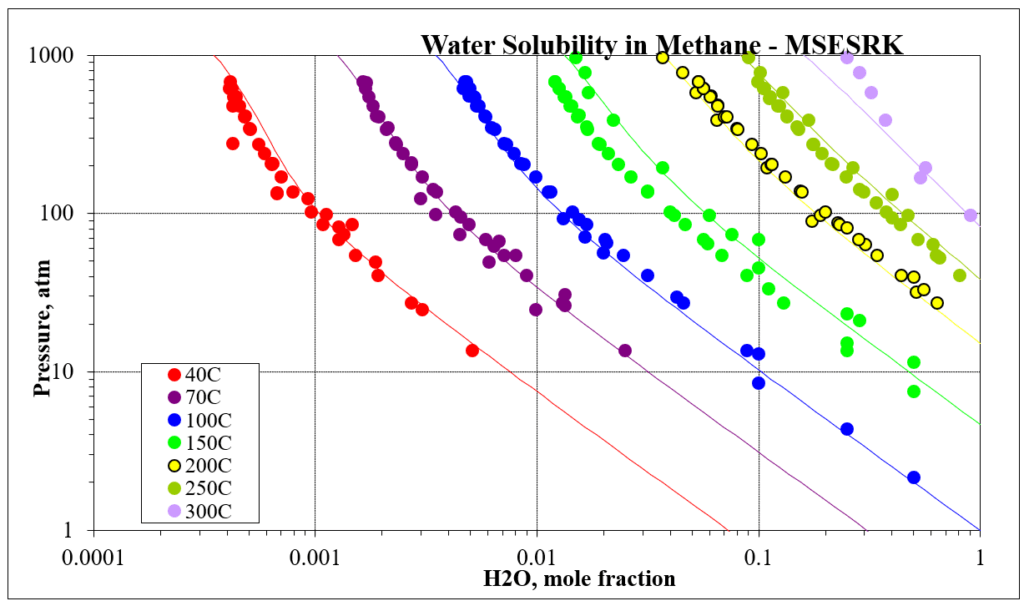
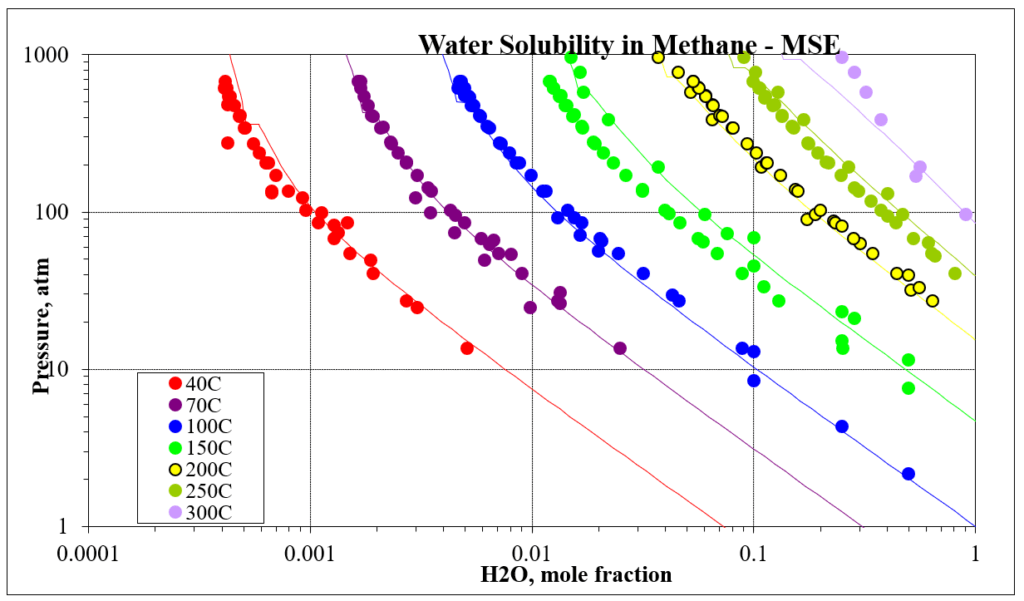
The next four plots show predictions for methane / water experimental vapor – liquid equilibrium. The first two show the methane solubility in water and the last two show the water solubility in methane. For this mixture the MSESRK and MSE predictions are similar and reliable.
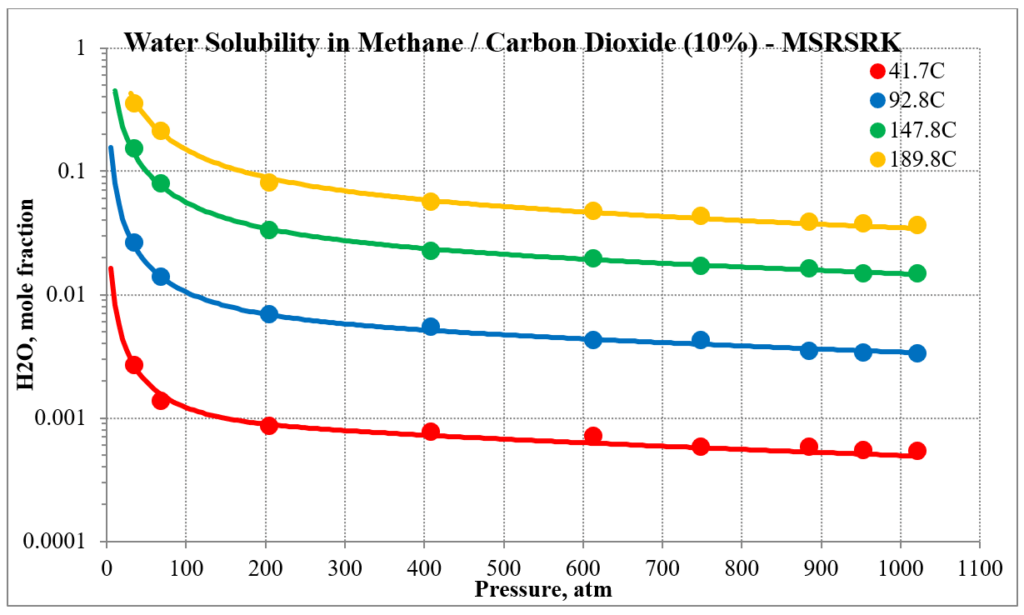
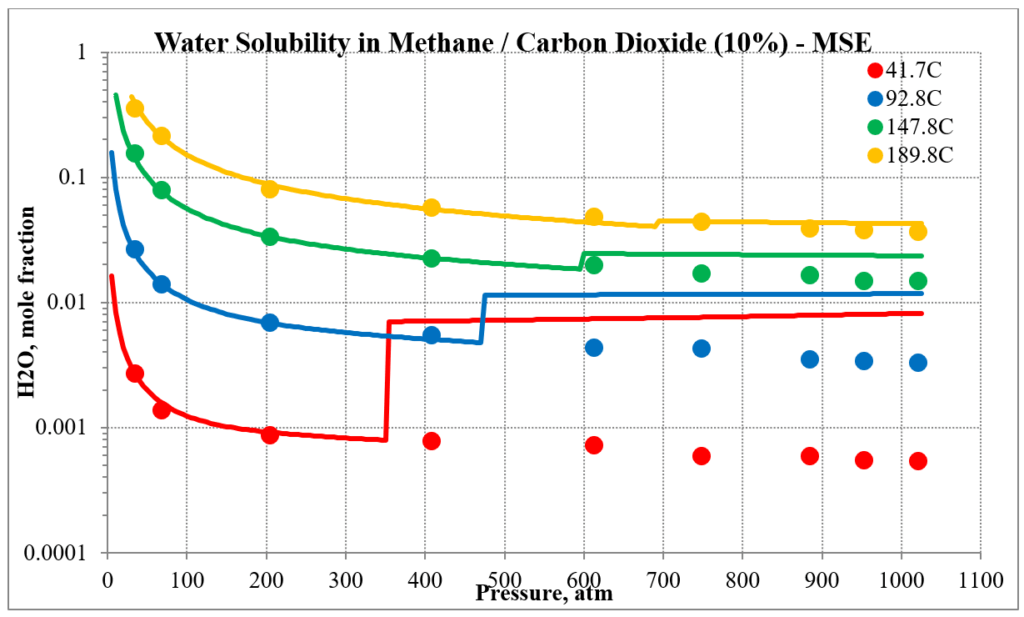
The next two plots show the solubility of water in a methane / carbon dioxide mixture. The break in the MSE plot is due to the mixture changing from vapor-like to liquid-like as the pressure increases. MSE uses a different model for each phase. This does not happen for MSESRK since the same model (SRK) is used for each phase.
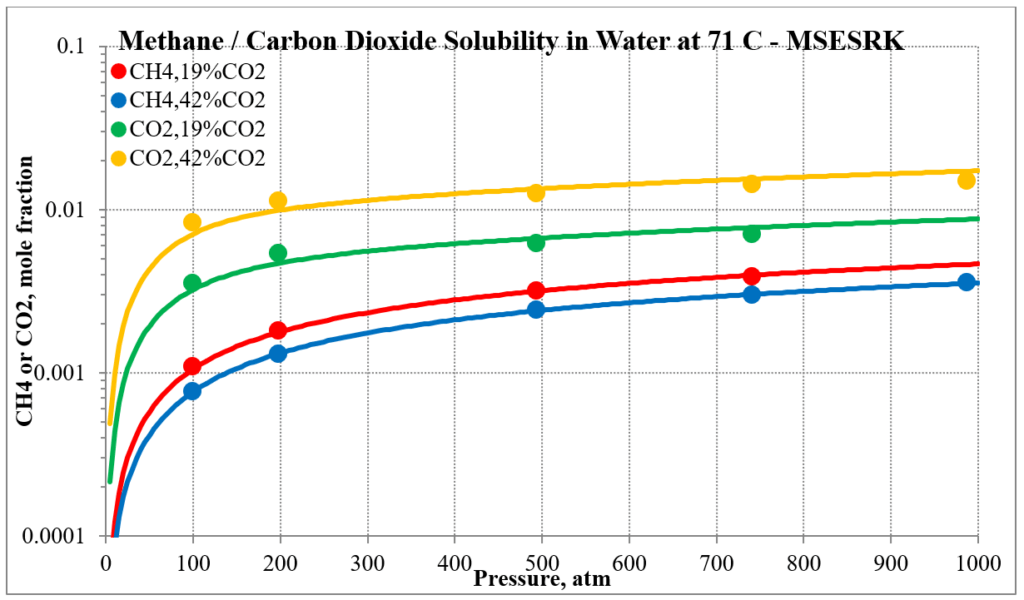
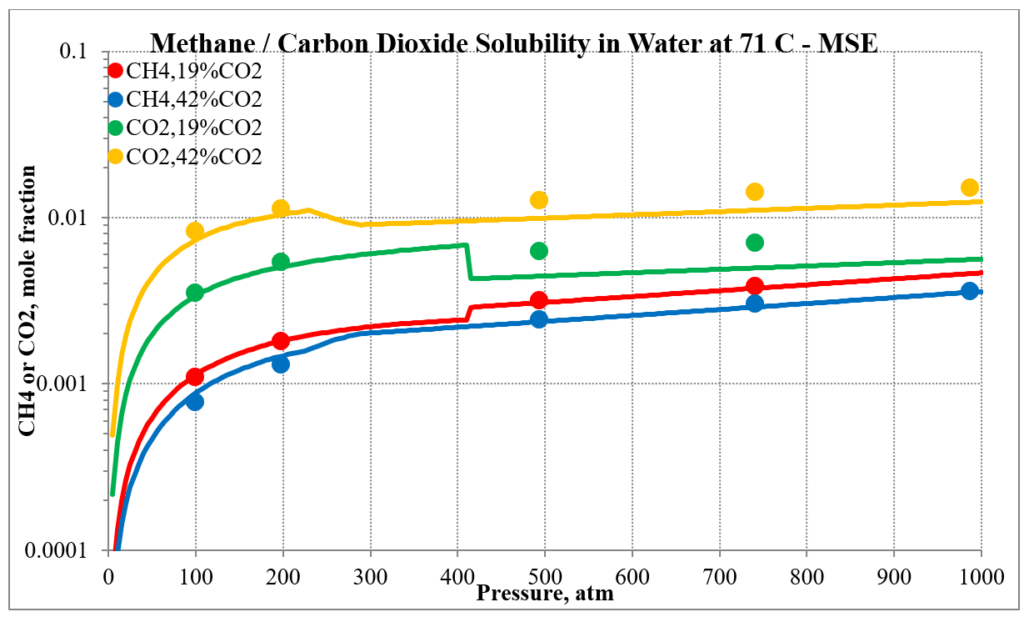
The last two plots show the solubility of methane and carbon dioxide in water for two different methane / carbon dioxide mixtures. Again, the break in the MSE plot is due to the mixture changing phase as the pressure increases.
MSESRK Features
Parameters were developed for several other components: MEG, DEG, TEG, formic acid, acetic acid, methanol, mercury, and sulfur so that reliable predictions can be made when there is a small amount (less than about 10%) of these components dissolved in hydrocarbons or light gases. This should be sufficient for the gas and oil production applications that MSESRK is intended for.
Finally, as indicated earlier, MSE is used for the water phase. So, all the aqueous phase properties in MSESRK are the same as MSE. This includes all the ions, aqueous species (without a vapor phase species) and solids (such as calcium carbonate, calcium sulfate, barium sulfate, etc.) species that are in MSE.