


Rare earth elements (REEs) constitute a group of chemically similar elements, encompassing fifteen lanthanides (from lanthanum to lutetium), scandium, and yttrium. Their distinctive physical properties render REEs indispensable in various industries, serving as crucial materials for manufacturing permanent magnets, metal alloys, phosphors, catalysts, polishing powders, and glass additives [1]. According to the International Energy Agency, demand for rare earth elements is expected to reach three to seven times current levels by 2040 [2].
Rare earth elements are widely distributed across the Earth’s crust, but generally in low concentrations. While there are more than 250 minerals that can contain REEs, economic-scale concentrations of rare earths are primarily found in carbonatites, alkaline igneous systems, ion-absorption clay deposits, and monazite-xenotime-bearing placer deposits. Considering the operational and geopolitical limitations of primary mineral deposits, much attention has been focused on secondary REE sources such as coal combustion products, including fly ash, bottom ash, and incinerator ash, industrial byproducts such as phosphogypsum, and electronic waste.
In the past few decades, extensive research has been devoted to developing efficient hydrometallurgical processes for the recovery of REEs from secondary sources. A bottleneck in the design of a hydrometallurgical process is often the selective separation of individual rare earth elements. Complexation plays a crucial role in the separation processes. REE oxalates, which combine low solubility with complex formation, are employed to separate REEs through precipitation and to produce fine-grained REE oxides. The separation of REEs from aqueous liquors using complex agents such as carboxylic or hydroxy-carboxylic acids requires understanding metal/ligand interactions. Thermodynamic analysis can help identify the most promising combinations of leachates and complexing agents for the solubilization of REEs, which can be precipitated later. Therefore, the thermodynamic behavior of REEs in the presence of organic complexing agents is crucial for designing separation processes.
In addition to separation processes, the complexation of REEs is essential for understanding the mass transfer of REEs in geological settings, including those relevant to the formation of sedimentary rocks, the genesis of petroleum and base metal deposits, and to the exploration of economic REE deposits of hydrothermal origin. Complexation with bioligands (e.g., citrate) is important for understanding REEs and actinides’ toxicity, distribution, and elimination in biological systems. In environmental engineering, complexation affects the biological activity in wastewater treatment plants subject to increasing REE inputs associated with the economic utilization of REEs [3].
Process simulation for complexed systems
To gain insight into the behavior of REEs in the presence of ligands, it is necessary to consider a diverse set of thermodynamic properties, including solid solubilities and complexation behavior (as exemplified by complexation constants derived from titration curves and species distribution obtained from spectroscopic studies) as a function of pH, temperature, REE concentration, and background electrolyte concentration.
To develop a realistic model of the thermodynamic behavior of rare earth elements in the presence of complex-forming ligands, it is necessary to identify and mathematically account for the key reactions in aqueous systems. Complexation reactions are intrinsically linked with phase equilibria and other thermodynamic properties. For each ligand, chemical reactions are associated with the formation of solid phases and with speciation equilibria in the solution. Like hydroxide ions, various organic ions form complexes with rare earth cations. However, the details of REE – organic anion speciation schemes are less well established than in the case of hydroxides. The complexation schemes are not inherently unique as they are influenced by both the nature of the experimental data and by model assumptions.
OLI Systems’ MSE framework
OLI Systems, Inc., a global electrolyte chemical technology leader which uses its proprietary Mixed Solvent Electrolyte (MSE) [4-6] thermodynamic model can model this complex behavior because of its capability to accurately reproduce solid-liquid, vapor-liquid, and liquid-liquid equilibria and chemical speciation in various electrolyte-containing mixtures in a range of temperatures.
OLI Software Platform V12 contains the requisite chemical species and calculates the thermodynamics properties that are necessary to enable science-based, data-driven, and reliable simulations. OLI Systems’ framework is sufficiently robust and extendible to deliver rigorous and accurate chemistry simulation for any complex and interactive chemistry of interest.
Previously, this framework was applied to model and simulate the phase behavior and caloric properties of binary and multicomponent aqueous systems containing rare earth chlorides and sulfates across the REE series. Additionally, the MSE model was utilized to study the complexation of REEs with selected chelating agents, including diethylenetriaminepentaacetic acid (DTPA) and tributyl phosphate (TBP) in biological media. It was also used to design REE separation processes through selective precipitation of sodium-REE-sulfate double salts from leachate solutions after solubilizing electronic waste. In other applications, the model was applied to the separation of REEs through the precipitation of carbonates or hydroxycarbonates and to the leaching of REEs from phosphogypsum using gluconic acid [7].
Here we list the examples about rare earth hydroxides, including a complete set of lanthanides and yttrium as well as organic ligands (citrate, acetate) with neodymium.
Rare earth hydroxides (REE(OH)3)
Experimental solubilities of REE hydroxides are reported primarily as a function of pH at various ionic strengths and temperatures. The solubilities are often reported as solubility products obtained by measuring the pH at the beginning of the hydroxide precipitation at a given ratio of REE3+ to OH–. The values of experimental solubilities and the derived solubility products strongly depend on the crystallinity of the precipitated solid. In general, the solids are categorized as either amorphous (alternatively referred to as freshly precipitated), crystalline, or intermediate (sometimes referred to as aged), depending on the equilibration history of the solids in solution.
Of all rare earth hydroxides, neodymium hydroxide has been investigated in the greatest detail. The MSE model reproduces the behavior of Nd(OH)3 and captures the key factors that influence the solubility, i.e., pH, temperature, concentration of background electrolyte (especially NaCl), and crystallinity of the solid phase. The dependence on pH and temperature is primarily determined by the standard-state properties of the solution species (i.e., NdOH2+, NdO+, and NdO2H), which have been adjusted in this work.
Figure 1a shows the solubility of neodymium hydroxide as a function of equilibrium pH at room temperature. In Figure 1b, the temperature range of the solubilities is expanded from 21.5 to 290 °C. As shown in Figure 1a, the model correctly captures the solubility behavior at 25 °C as a function of pH and the concentration of background electrolytes, i.e., NaCl or NaClO4. While the pH effect on solubility is dominant, the solubility also moderately increases with NaCl concentration in the near-neutral pH range (from pH ~6.5 to 8.5). This trend is not observed at higher pH as the experimental data show a significant scatter beyond pH 9.
Figure 1b focuses on the temperature dependence as well as the pH dependence of the Nd(OH)3 solubility and also includes the solubility of amorphous Nd(OH)3 at room temperature, which is much higher than that of crystalline Nd(OH)3. The significant difference between the solubilities of crystalline and amorphous Nd(OH)3 is accounted for by a shift in the Gibbs energy of formation of the solid phase. For the crystalline phase, the solubilities lie within the scattering of experimental data and capture the solubility increase with NaCl concentration (cf. the solid lines in Figure 1a,b). The model also provides a reasonable estimate of the solubility of amorphous Nd(OH)3 (cf. the dotted line in Fig. 1b), which is consistent with the reference experimental data.
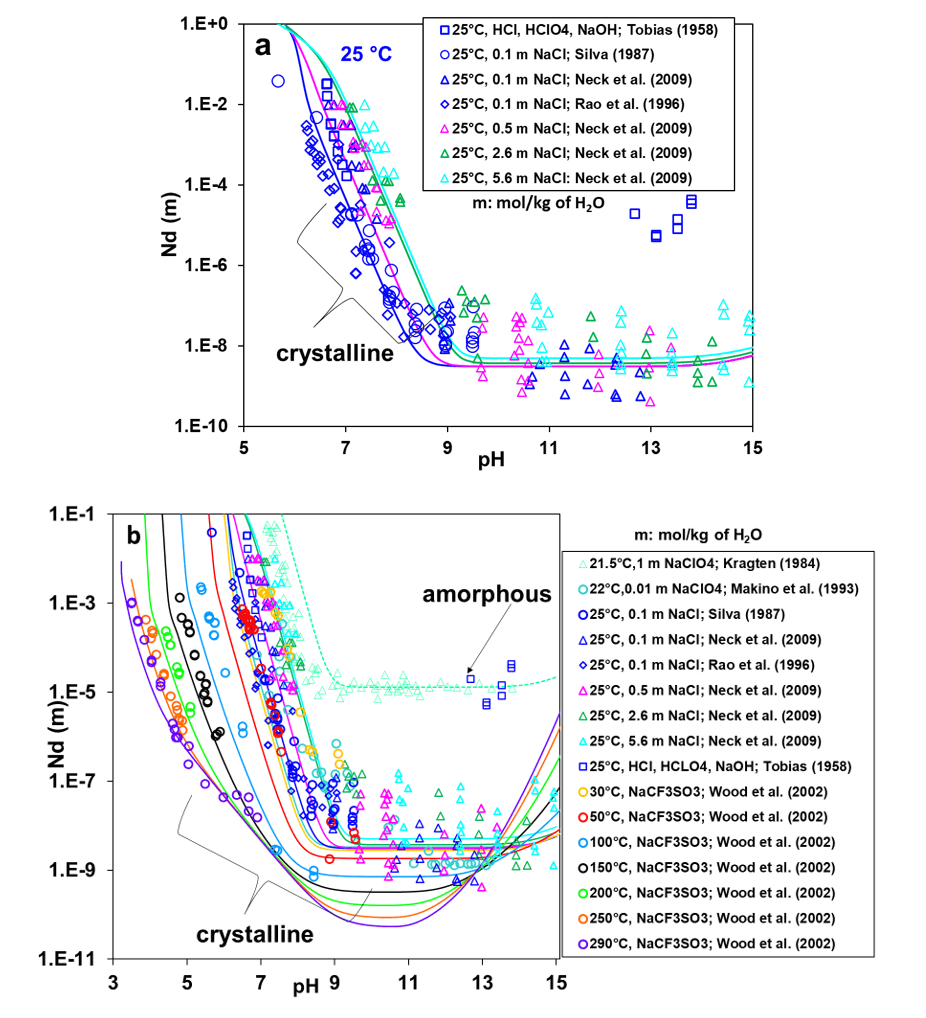
Figure 1: Calculated and experimental solubility of neodymium hydroxide: (a) Crystalline Nd(OH)3 at various NaCl concentrations at 25 °C; (b) Both amorphous and crystalline Nd(OH)3 at temperatures from 21.5 to 290 °C in various environments. The symbols represent experimental data whereas the solid and dotted lines represent the calculated solubility of crystalline and amorphous Nd(OH)3, respectively.
Regularities in the behavior of rare earth hydroxides
The thermodynamic behavior of REE compounds usually follows a regular trend across the lanthanide series. Therefore, based on the model calculations, an attempt has been made to identify such trends within the REE(OH)3 series. The calculated solubilities of all fourteen lanthanide hydroxides, from La to Lu, plus yttrium hydroxide, are presented in Figure 2 as a function of pH at 25 °C without any background electrolyte. The solubilities of lanthanide hydroxides display a decreasing trend from La to Lu as a function of decreasing crystal cation radii or increasing molecular weight. This is especially apparent for the lighter lanthanides. The solubility of Y(OH)3 falls between Ce and Pr hydroxides even though the crystal cation radius of Y is similar to that of Ho. It can be observed that the solubilities of lanthanide hydroxides show much greater variability in the acidic-to-neutral pH range than in the basic pH range above 9.5. Thus, the pH threshold for the precipitation of REE hydroxides varies in a regular way across the lanthanide series.
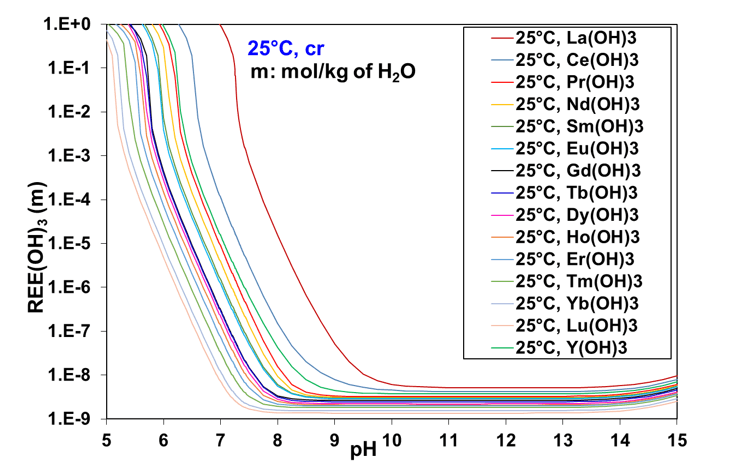
Figure 2: Comparison of calculated solubilities of rare earth hydroxides as a function of pH in the absence of background electrolyte at 25 °C.
Rare earth elements with organic ligands
The selected organic ligands are citrate, acetate, and oxalate. The parameters have been determined in all cases by considering the available speciation and solid solubility data. The selection of complexes was based on a combined, multi-property analysis of various experimental data sets to reproduce the available data with a miminum self-consistent set of complex species.
Figure 3 shows experimental and calculated titration curves for the Nd(ClO4)3 – H3Cit – LiClO4 – LiOH – H2O system at 25 °C. In general, a titration curve reflects speciation in a chemical system. The shape of the titration curves is the net effect of the predominance of individual species and the transitions between them. The characteristic trends observed in the titration curves in Figure 3 occur due to the changes in speciation while varying pH using LiOH as a titrant at four different initial Nd(ClO4)3 concentrations: 0.0043 mol/dm3 (blue curve), 0.0065 mol/dm3 (green curve), 0.0108 mol/dm3 (pink curve), and 0.0216 mol/dm3 (red curve). At the highest Nd concentration, the titration curve terminates at a lower volume of the LiOH titrant because of the formation of neodymium hydroxide. The MSE model reproduces the experimentally observed titration curves within the experimental error limit by accounting for appropriate transitions in speciation depending on the Nd and LiOH concentrations.
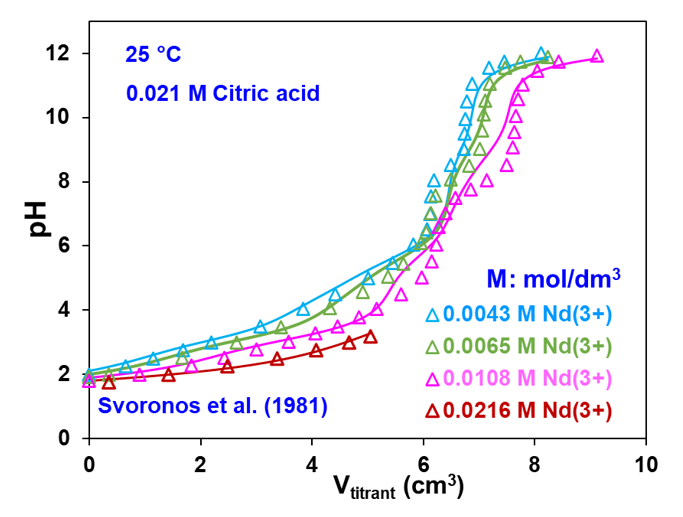
Figure 3: Potentiometric titration of an Nd(ClO4)3 – citric acid – LiClO4 solution as a function of added LiOH titrant volume for various initial Nd3+ concentrations at 25 °C. The symbols are experimental data whereas the solid lines are obtained from the model.
Figure 4 illustrates the deduced speciation of neodymium citrate complexes as a function of pH. The four parts of Figure 4 (i.e., a, b, c, and d) correspond to the conditions of the titration curves shown in Figure 3. Based on a combination of titration curves and solubility data (see below), the MSE model introduces five Nd – citrate complexes, i.e., NaHCit+, NdCit0, Nd(OH)Cit–, NdHCit22-, and NdCit23-. Figure 4a illustrates how the composition of the predominant species changes as a function of pH in the solution with an initial neodymium concentration of 0.0043 mol/dm3. In the low pH range (between pH ~2-3), the NaHCit+ species dominates, then it is replaced by NdHCit22- as pH increases. A neutral complex, NdCit0, exists at pH values between ~2-4, but its concentration is small. A dicitrate complex, NdCit23-, dominates in the pH range between ~6-9 and is followed by the hydroxy-citrate complex, Nd(OH)Cit– at pH above ~9. Figures 4b, 4c, and 4d show a very similar pattern for the remaining Nd concentrations except for an increase in the concentration of the neutral NdCit0 species, especially in the moderately acidic pH region around 4.
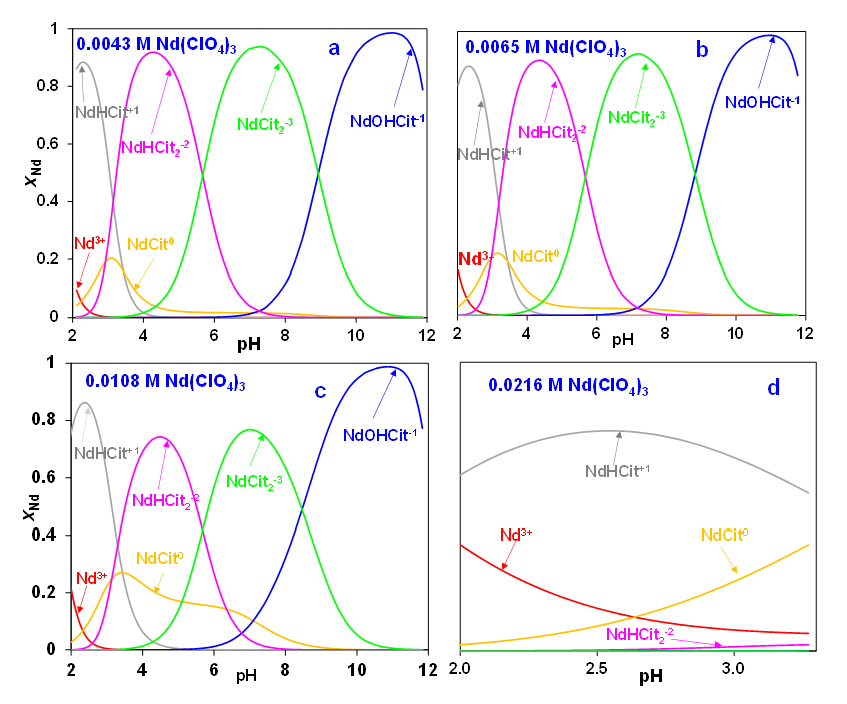
Figure 4: Calculated speciation of neodymium citrate complexes at 25 °C as a function of solution pH in a perchlorate medium with neodymium concentrations of (a) 0.0043 M, (b) 0.0065 M, (c) 0.0108 M, and (d) 0.0216 M. (M: mol/dm3)
Rare earth acetates
The complexation behavior of neodymium with another organic complex former, acetate, is presented in Figure 5 which shows the distribution of Nd species (expressed as a percentage of total Nd) at 25 and 70ºC as a function of the ratio of the total concentrations of acetate and neodymium ions. At 25 ºC, the dominant species changes with an increase in acetate concentration from uncomplexed Nd3+ to NdAc2+, followed by NdAc2+ and finally by the neutral NdAc30 species. This pattern changes somewhat at 70 ºC as the neutral NdAc30 species becomes more dominant at high acetate concentrations while the predominance regions of NdAc2+ and NdAc2+ shrink to narrower ranges. The model accurately reproduces the speciation at both temperatures.
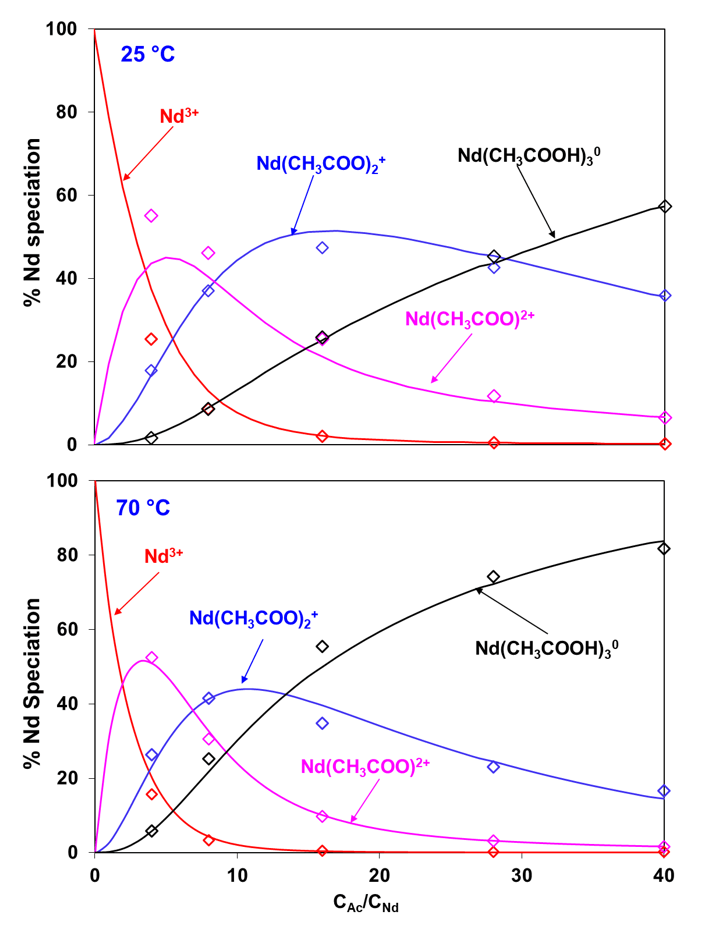
Figure 5: Distribution of neodymium acetate species in 2 m NaClO4 with pH 4.7 and total Nd3+ concentration of 0.025 m at (a) 25 °C and (b) 70 °C as a function of varying acetate concentration. The symbols represent experimental data whereas the lines are model calculations. (m: mol/kg of H2O)
Conclusion
The OLI MSE model framework successfully models the behavior of rare earth hydroxides for 14 elements, i.e., for yttrium and the lanthanides except for promethium. It can also model REE with citrate, acetate, and oxalate species. In the framework, a simultaneous, multi-property analysis was conducted, integrating experimental data on speciation and solubility from various sources. This approach allowed for the refinement of thermodynamic parameters governing the complexes, thereby increasing the likelihood of obtaining realistic chemical speciation simulations.
What tools are available for modeling REE with hydroxide and organic ligands?
The OLI MSE framework is uniquely positioned to model the behavior of REEs, and MSE is a proven model that can accurately simulate complex, multi-component electrolyte systems. It provides engineers with the ability to design more efficient processes, and to predict more closely than ever before the yield and purity of their products.
OLI Systems’ simulation packages, which are based on the MSE model, are available in OLI Studio V12 and OLI Flowsheet ESP V12.
Contact OLI at https://www.olisystems.com/contact-us for more information or to schedule a meeting with an OLI expert.
References
- M.S.K. Ilankoon, N.P. Dushyantha, N. Mancheri, P.M. Edirisinghe, S.J. Neethling, N.P. Ratnayake, N.M. Batapola, J. Clean. Prod. 331 (2022) 1-16.
- https://www.technologyreview.com/2024/01/05/1084791/rare-earth-materials-clean-energy/
- Das, M. M. Lencka, J. P. Liu, A. Anderko, R. E. Riman, A. Navrotsky, Modeling phase equilibria and speciation in aqueous solutions of rare earth elements with hydroxide and organic ligands, 2023, J. Chem. Thermodynamics, 186, 107125.
- Wang, A. Anderko, R.D. Young, Fluid Phase Equilib. 203 (2002) 141-176.
- Wang, R.D. Springer, A. Anderko, R.D. Young, Fluid Phase Equilib. 222 (2004) 11-17.
- Wang, A. Anderko, R.D. Springer, R.D. Young, J. Mol. Liq. 125 (2006) 37-44.
- Antonick, Z. Hu, Y. Fujita, D.W. Reed, G. Das, R. Shivaramaiah, P. Kim, A. Eslamimanesh, M.M. Lencka, Y. Jiao, A. Anderko, A. Navrotsky, R.E. Riman, J. Chem. Thermodyn 132 (2019) 491-496.