


Reinforced concrete structure degradation remains a serious issue in infrastructural systems, such as buildings, highways, and bridges [1]. The most severe form of the problem is caused by the presence of chloride, either from being present in the concrete mix (e.g., from the use of brackish water or the addition of CaCl2 as a “setting agent”) or by ingress from the external environment (e.g., road salt, marine environments). Sometimes sodium chloride is added to the cement due to the ability to accelerate cement hydration and reduce set time by as much as two-thirds (that can be important at low temperatures).
Chloride results in the breakdown of the passive state on the carbon steel rebar, which is in contact with alkaline (pH = 12.5–13.8) concrete pore solution (CPS). Passivity breakdown results in rapid corrosion and in the formation of corrosion products at the steel/concrete interface that are characterized by a high Pilling Bedworth ratio (ratio of the molar volume of the rust to the molar volume of the corresponding metal) resulting in the concrete at the interface being placed under tensile loading. Noting the poor mechanical properties (e.g., fracture strength) of concrete under tensile loading the concrete fractures thereby compromising the integrity of the reinforced structure. The scheme of possible corrosion degradation is shown in Figure 1.
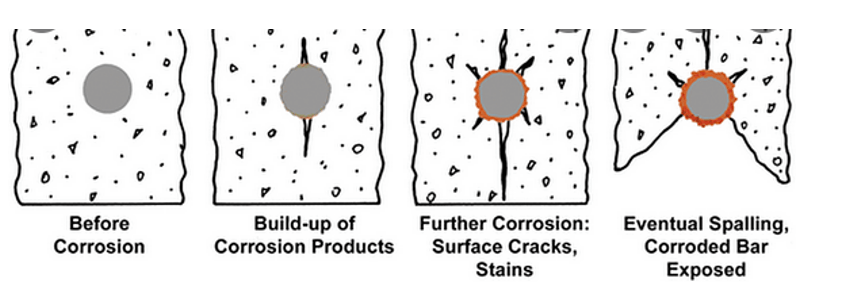
Figure 1. The scheme of possible corrosion degradation. The brown stuff in the figure denotes rust.
Over the past several decades, a metric has been developed to describe the susceptibility of the steel to chloride-induced passivity breakdown and hence the onset of mechanical failure of the reinforced concrete structure. That metric is termed the chloride threshold (CT), which is frequently expressed in engineering terms as the total mass of chloride ion in the concrete as a percentage of the mass of cement used to prepare the concrete mixture (%TotalCl/cem). This metric can be further refined as the % mass of free (that is, not bound to other species in the concrete and present in the pore water) chloride/cement mass (%FreeCl/cem), reflecting the assumption that chloride that is bound is not available to induce passivity breakdown. Accordingly, by assuming that the bound chlorides are completely removed from the pore solution and present no risk for pitting initiation, it would make sense to only consider the free chlorides. Thus, chloride threshold values are also expressed by the use of free chloride contents, either related to the weight of cement or concrete or as concentration in the pore solution. Consistent with that assumption, a more rational expression for CT that is independent of the type of cement is the ratio of concentrations, [Cl–]/[OH–], in the concrete pore water in contact with the steel [1]. Here OH– is considered as an inhibitor of corrosion.
By now, the comprehensive data for predicting CT in terms [Cl–]/[OH–] can be found in the literature [1-3]. Below it will be shown how it is possible to estimate the value of [Cl–]/[OH–] by using the OLI software and by doing so to predict the probability of the chloride-induced passivity breakdown in practical systems.
Practical example of application of OLI’s software for estimating the chloride threshold (CT)
Usually, the composition of cement is expressed in mass (weight) present. Let us consider a practical example of cement comprising 65.1 CaO, 21.1 SiO2, 5.3 Al2O3, 2.9 Fe2O3, 1.84 MgO, 1.9 SO3, 0.83 Na2O, and 0.95 K2O in mass % at T = 25 ◦C and P =1 atm. By using the evident relation for transferring the concentration of i-th component of the cement in weight (mass) percent, wi, to the mol. %, mi:
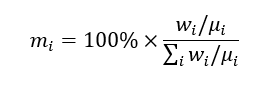
where μ is the molecular weight, we can express the composition of the cement as: 69.3 CaO, 21.0 SiO2, 3.1 Al2O3, 1.1 Fe2O3, 2.72 MgO, 1.4 SO3, 0.08 Na2O, and 0.6 K2O in mol %.
One must be noted a crucial issue. Usual concrete is made from cement, sand, gravel, and water. By preparing the concrete it is important to use a minimal amount of water to achieve a workable, reliable slump. The excess water can cause an undesirable increase in the porosity of concrete. Accordingly, the definition of the minimum amount of water required for appearing the stable liquid phase in concrete can be considered an important design task in the production of concrete. It means that practical calculations must be performed under conditions when a limited amount of liquid phase appears in the mixture. In turn, it means that calculations using OLI’s software must be performed only by using the Mixed Solvent Electrolyte (MSE) model [4] (not the Aqueous model). In accordance with our knowledge, the MSE model is the single commercially available model (with the accompanying software) that allows users to perform reliable thermodynamical estimations under conditions when a limited amount of water is present in the system.
Practically calculations are performed in the following way. It is chosen the proper scale for the amount of the number of moles of the cement components. The simplest way is to choose the number of moles for each component equal numerically to the mass concentration of this component in the cement. Thus, for example, the number of moles for CaO is chosen as 69.3 moles, etc. Finally, the composition survey relative to added water is performed. The mass part of added water relative to the mass of the cement, Wcem, is expressed as:
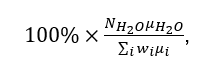
where NH2O is the number of moles of water added to the cement mixture at each survey step.
Figure 2 shows the results of the calculations. Calculations show that the liquid phase appears when the weight part of added water relative to the cement, Wcem, increases 0.38 (38 %). In the range 0.38< Wcem<0.47 the system shows unstable behavior (pH changes in a wide range). At Wcem > 0.47 Wcem, pH monotonically decreases and accordingly CT = [Cl–]/[OH–] increases (that is undesirable from a corrosion standpoint). It is interesting to note that in many cases, it is recommended to mix concrete ingredients (cement, sand, gravel, and water) in a ratio of 1:2:3:0.5 to achieve maximum strength. That is 1 part cement, 2 parts sand, 3 parts gravel, and 0.5 part water. As we can see the minimum amount of water relative to cement that can be recommended in our case, namely 0.47 (47%), is close to the often recommended value of 0.5 (50%).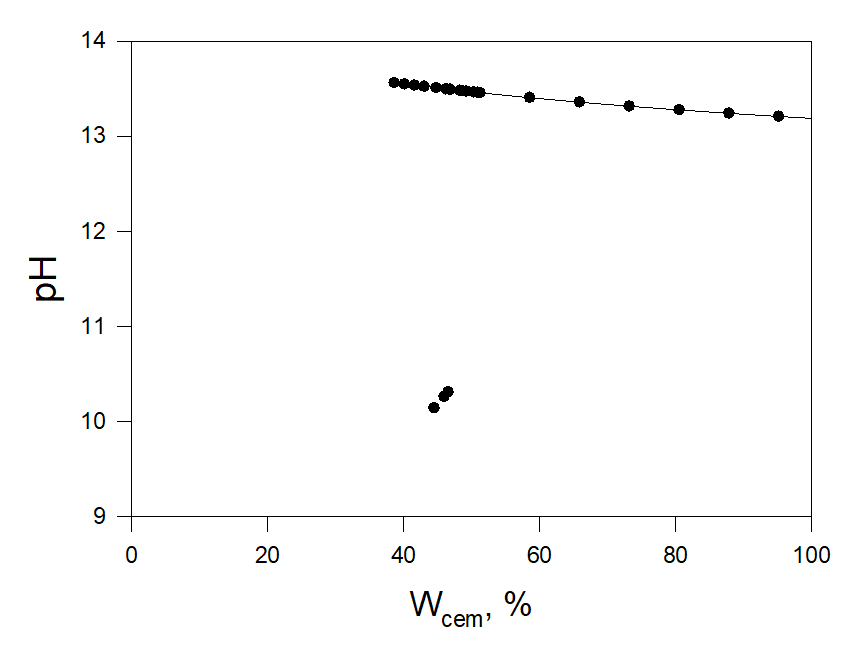
Figure 2. Weight part of added water relative to the cement, Wcem. Blac circles are the calculated values.
For any added amount of moles of water OLI software comfortably yields at the output the number of moles of Cl– and OH– in the liquid phase that allows users immediately calculate the ratio [Cl–]/[OH–]. Figure 4 shows calculated values of [Cl-]/[OH-] at different additions of CaCl2, ACaCl2, to the cement. As can be expected this ratio increases with the increase of the added amount of calcium chloride. The experimental value of CT = 0.69 (69 %) [3] is also shown in Figure 3. Based on the results shown in Figure 3 we can expect that there is a high possibility that reinforcement corrosion occurs when ACaCl2 = 0.5 %. On the other hand, we can expect that reinforced corrosion degradation will not occur at ACaCl2 = 0.1 %, 0.25 %, and 0.37 %. It looks like it can be recommended not to use additions of CaCl2 relative to the considered cement of more than 0.37 %.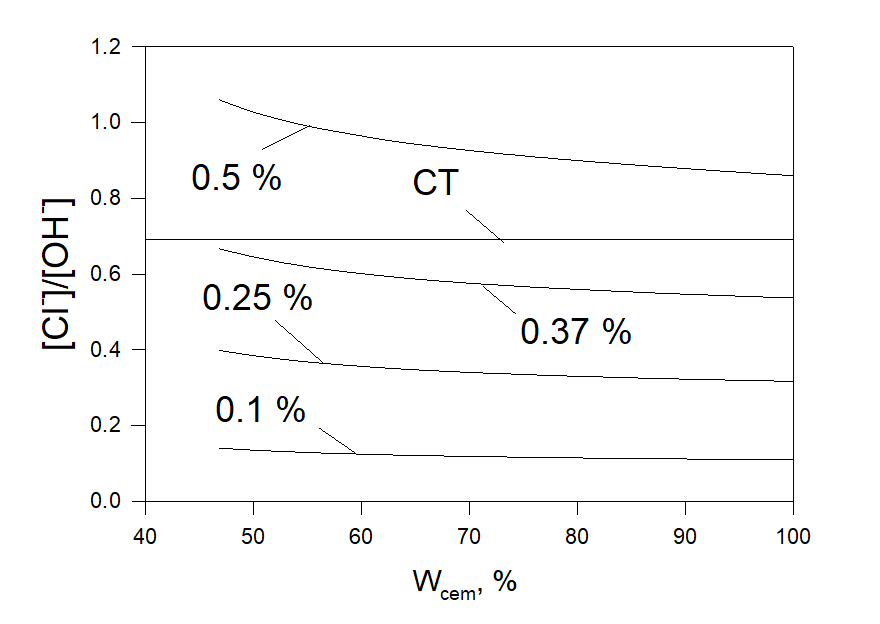
Figure 3. The ratio [Cl–]/[OH–] as a function of the part of added water relative to the cement at different additions of CaCl2 to the cement, %. The experimental value of CT = 0.69 [3].
Remarks
In the considered example we assumed that chloride appears in the pores of concrete only due to the addition of CaCl2 to the mix (as it was done in Ref. 3). However, often Cl– accumulates near the metal surface in the pores of concrete by ingress from the external environment. Under these conditions, the corresponding mass transfer model for estimating [Cl-] near the metal surface (which may be rather complicated) must be developed for possible prediction of the chloride threshold (CT).
As was mentioned in Ref. 1 there are two different ways of defining CT. From a so-called “scientific” point of view, the critical chloride content can be defined as the chloride content required for depassivation of the steel, whereas from a practical so-called “engineering” point of view CT is usually the chloride content associated with visible or “acceptable” deterioration of the reinforced concrete structure. These definitions have different time scales. Thus “scientific definition” is related to the initiation stage of degradation whereas the “engineering” definition is related to the visible or acceptable stage of CT. An example of theoretical estimation of CT on the base of the “scientific” definition can be found in Ref. 5. OLI’s software can be used in some cases for estimating repassivation potential, and, accordingly for predicting CT from the “scientific” point of view.
Conclusion
OLI’s software on the basis Mixed Potential Model yields a reliable and comfortable tool for estimating the minimum amount of water and the maximum amount of chloride that can be added to the concrete mix in order to achieve a workable, reliable slump and to avoid the degradation of the reinforced concrete structure due to the chloride threshold. Estimations can be performed for different types of cement with complicated structures in a wide range of temperatures and pressure.
References
- Angst, B. Elsener, C.K. Larsen, Ø. Vennesland, Critical chloride content in reinforced concrete – A review, Cem. Concr. Res. 39 (2009) 1122–1138.
- E. Hussain, A. Rasheeduzzafar, A. Al-Musallam, A.S. Al-Gahtani, Factors affecting threshold chloride for reinforcement corrosion in concrete, Cement and Concrete Research 25 (1995) 1543–1555.
- Andrade, C.L. Page, Pore solution chemistry and corrosion in hydrated cement systems containing chloride salts: a study of cation specific effects, British Corrosion Journal 21 (1986) 49–53.
- J. Kosinski, P. Wang, R.D. Springer, A. Anderko, Modeling acid-base equilibria and phase behavior in mixed-solvent electrolyte systems, Fluid Phase Equilib. 256 (2007) 34–41.
- D. Macdonald, Y. Zhu, Jie Yang, J. Qiu , G. R. Engelhardt, A. Sagü, L. Sun , Z. Xiong, Corrosion of rebar in concrete. Part IV. On the theoretical basis of the chloride threshold, Corros. Sci., 185, June 2021, 109460.