


Geothermal energy represents a significant opportunity as a sustainable power source, offering a clean, reliable, and virtually inexhaustible supply of energy. Its potential to reduce greenhouse gas emissions and decrease reliance on fossil fuels makes it a key component of the global shift toward renewable energy. However, geothermal operations must overcome substantial technical challenges that can impact efficiency and long-term viability. One of the most critical issues is scaling—the precipitation of minerals such as silica, sulfides, and carbonates at various operational stages. These mineral deposits can obstruct equipment, reduce heat transfer efficiency, and increase maintenance costs, ultimately affecting the economic feasibility of geothermal plants. To mitigate these challenges, OLI Systems has developed cutting-edge thermodynamic models embedded within its software platform designed to predict and analyze scaling behavior with exceptional precision. The OLI’s technology provides operators with the ability to anticipate scaling issues, refine plant design, and implement targeted mitigation strategies.
Case Study: Insights from the Salton Sea Geothermal Field
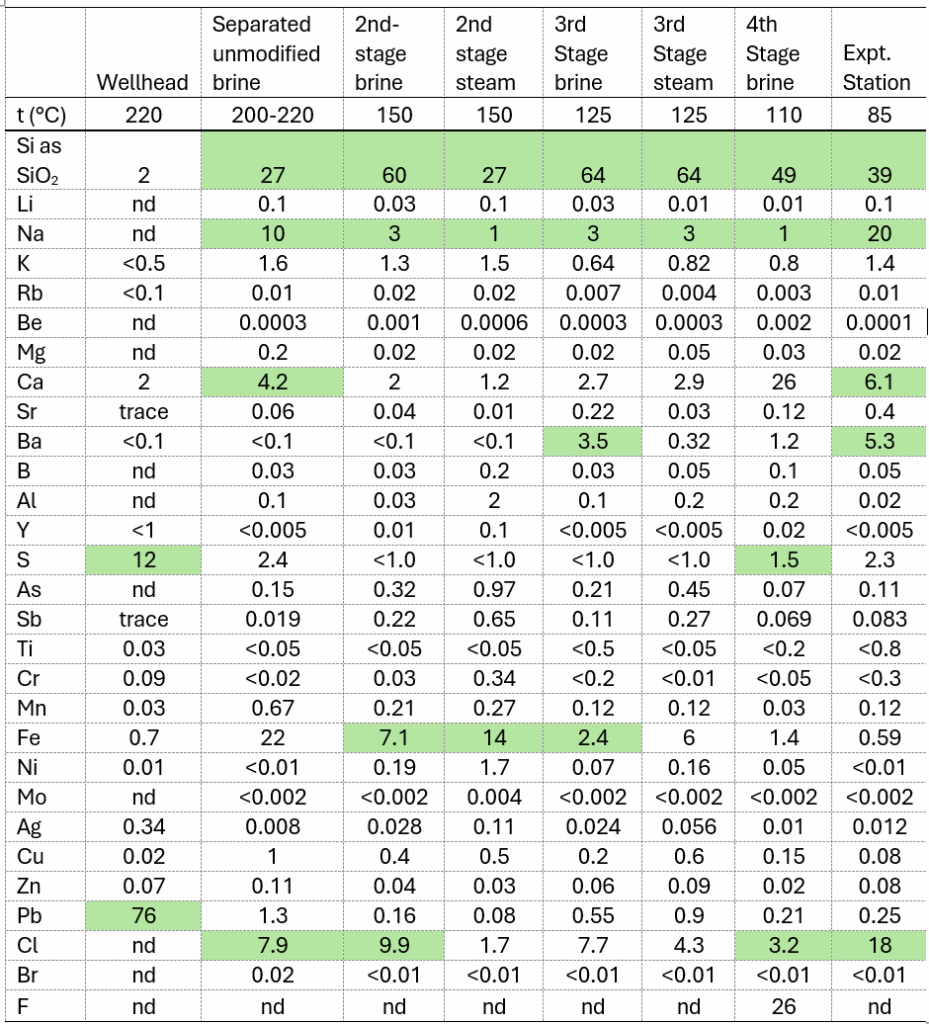
This analysis focuses on brine samples from the Salton Sea Geothermal Field (SSGF) in California, USA—an area renowned for its high temperatures, elevated salinity, and potential for both energy and mineral recovery. The brine composition data utilized in this study are drawn from the work of Maimoni [1], specifically examining the Magmamax No. 1 well. While this well was selected arbitrarily, its brine properties have been thoroughly investigated [2-4], including in a recent study by Dobson et al. [5], making it representative of the broader geothermal brine characteristics in the SSGF region. Table 1 presents the composition of geothermal brine samples as reported by Maimoni [1], while Table 2 provides an analysis of scale composition at different stages of a four-stage geothermal flash system (c. f. Figure 1). This analysis, initially reported by Harrar et al. [6] and later referenced by Maimoni [1] offers critical insights into scaling behavior and its implications for geothermal plant operations.
Figure 1 provides a simplified representation of the four-stage flash system, including identified sampling ports referenced in Table 2, which was utilized by Harrar et al. [6] for the collection and characterization of scale deposits. Table 2 highlights significant changes in deposit characteristics as the brine flowed from the wellhead through the different stages of the system. Various compounds precipitated preferentially at different points in the equipment, influenced by factors such as temperature, the concentration of reactive volatile species (e.g., H₂S and CO₂), and residence times. For example, while the high-temperature wellhead scale contained only 2% SiO₂, a lower-temperature scale exhibited up to 64% silica. The analysis also identified the presence of metal sulfides, including PbS, CuFeS₂, ZnS, and CuS, in the deposits across different stages of the operation. Additionally, significant concentrations of Na, Ca, and Ba were observed at specific stages of the operation – indicating the formation of halite, calcite, and barite scales. This analysis forms the basis for comparing actual field observations of deposit compositions with OLI model predictions, as discussed in the following section.
Table 1: Brine composition during production of Magmamax No. 1 well (concentrations are in ppm by weight)[1]

Table 2. Analyses of scale from Magmamax No. 1 wellhead and the LLNL four-stage flash system after about 720 h of operation (Table 3, Reference [1]) [Data represents wt% of deposit]
* Highlighted cells indicate significant deposits associated with specific stages of the operation.
Analysis of the brine sample using OLI’s software platform
Figures 2–6 present the analysis results corresponding to the brine compositions listed in Table 1. These figures depict plots of scaling indices for scale-forming minerals as a function of temperature, ranging from 25°C to 250°C. A scaling index value greater than 1 signifies supersaturation and the onset of scaling. This temperature-dependent survey enables the evaluation of scaling characteristics and the conditions under which scales form as the brine flows through the geothermal operation from the wellhead (225°C) to the experimental station (85°C) (cf. Table 2 and Figure 1).
Figure 3 elucidates the analysis of brine collected on 09/29/1979 (cf. Table 1) using the OLI software platform. The results highlight the formation of amorphous silica (SiO₂), Sb₂O₃, and halite (NaCl) scales as the temperature decreases during the brine’s transit from the wellhead to the experimental station. A significant amount of silica scale is predicted to form between the second-stage flash and the experimental station, within a temperature range of 175°C to 75°C. This prediction from the OLI model is substantiated by experimental observation, which indicates a marked increase in silica deposition below 150°C. Similarly, halite scaling predictions are consistent with the experimental observations, revealing high concentrations of Na and Cl in the deposits, particularly in the second-stage brine (cf. Table 2). The OLI calculations also predict the precipitation of Sb as Sb₂O₃ starting at approximately 100°C, aligning with observations detailed in Table 2. Sb₂O₃ scaling has also been predicted during the analysis of brines collected on 06/30 and 08/10/1979 (8/10a) (cf. Figures 4 and 5).
Silica is perhaps the most commonly encountered scale in geothermal operations, appearing in all analyzed brine samples (cf. Figures 3-7). Analysis of the 8/10b brine sample using OLI software platform reveals the deposition of Cu (as CuS), Fe (as FeCO₃ and FeS), Pb (as PbS), Zn (as Zn silicate and ZnS), and Mn (as MnCO₃) (cf. Figure 7). These findings agree with experimental observations of carbonate and sulfide scale formation detailed on Table 2. In addition, sample 8/10a (cf. Figure 6) analysis indicates the precipitation of AlOOH, along with Sb and Si. These results align closely with the deposition data presented in Table 2, validating the accuracy and reliability of the model predictions.

Figure1: The Lawrence Livermore Laboratory geothermal four-stage flash system
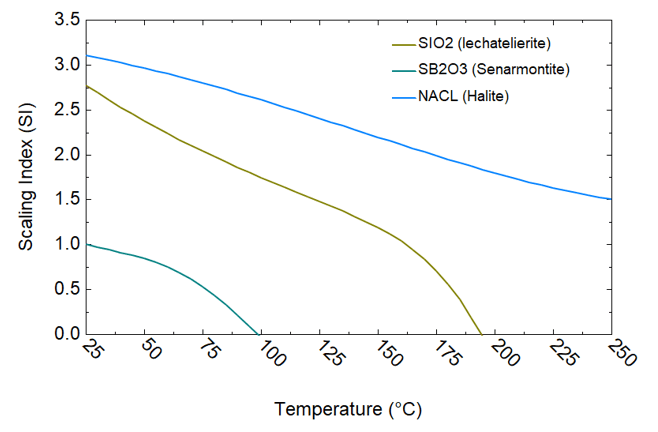
Figure 2. Scaling analysis of brine 6/29 using OLI’s software platform
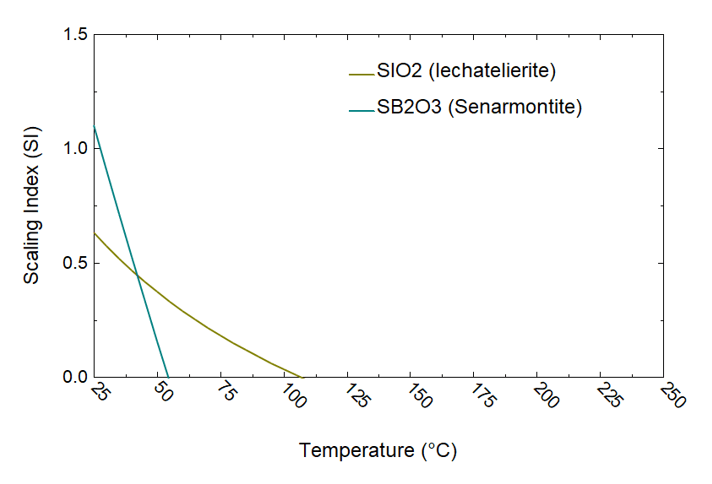
Figure 3. Scaling analysis of brine 6/30 using OLI’s software platform
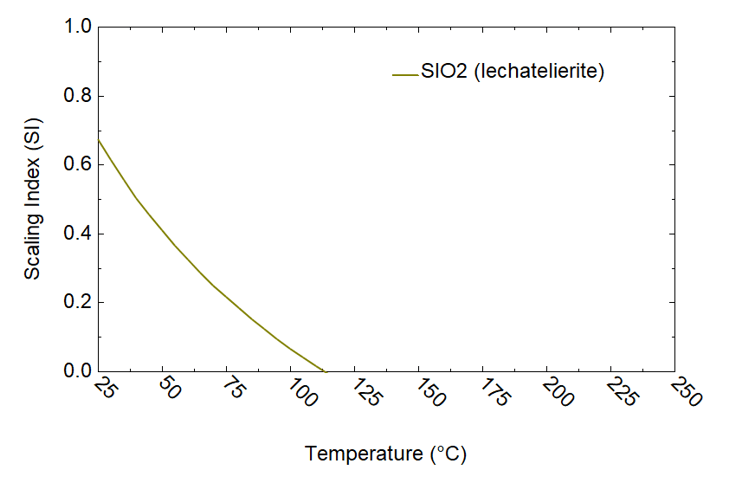
Figure 4. Scaling analysis of brine 8/08 using OLI’s software platform
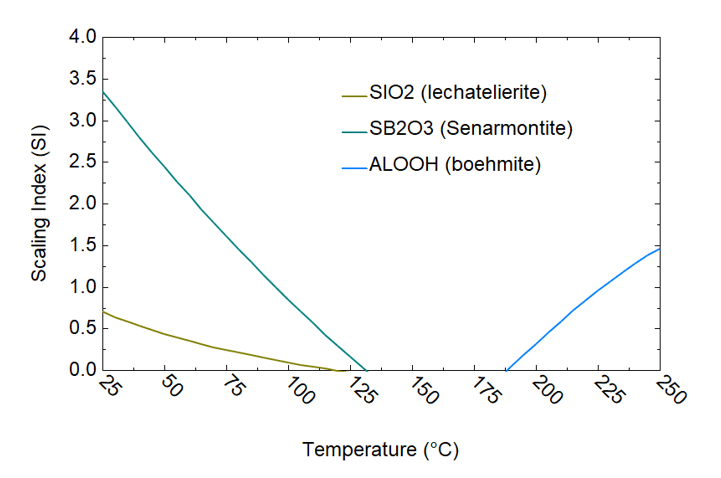
Figure 5. Scaling analysis of brine 8/10a using OLI’s software platform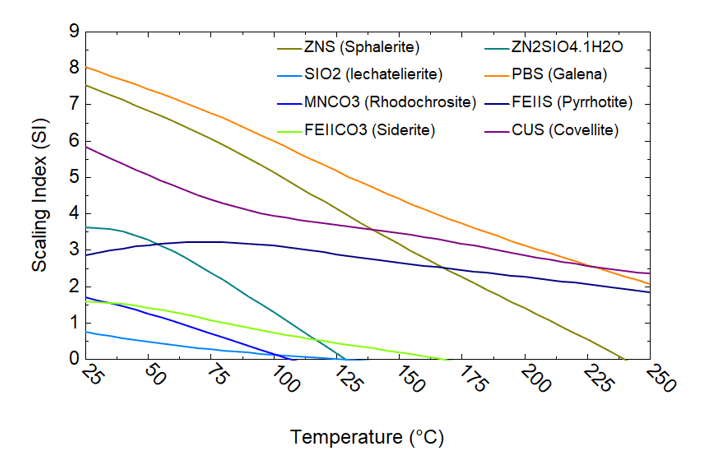
Figure 6. Scaling analysis of brine 8/10b using OLI’s software platform
The Road Ahead
OLI’s validated models are more than analytical tools—they are catalysts for innovation. By delivering predictive insights, these models empower operators to:
- Enhance geothermal plant performance
- Mitigate scaling-related disruptions
- Maximize resource recovery potential
As the demand for renewable energy grows, predictive tools like OLI’s models play a crucial role in unlocking geothermal energy’s full potential. Utilizing OLI’s advanced modeling platform allows for a deeper understanding of scaling dynamics, facilitating data-driven solutions to optimize geothermal energy production.
Join the Conversation
Scaling challenges are complex, but with data-driven insights, we can overcome them. Connect with us to explore how OLI’s thermodynamic models can enhance the efficiency of your geothermal operations.
References
[1] A. Maimoni, Minerals recovery from Salton Sea geothermal brines: A literature review and proposed cementation process., Geothermics, 11 (1982) 239-258.
[2] A.L. Austin, A.W. Lundberg, L.B. Owen, G.E. Tardiff, The LLL Geothermal Energy Program Status Report, in: UCRL-50046-76, Lawrence Livermore National Laboratory, Livermore, California, 1977.
[3] S.R. Cosner, J.P. Apps, A Compilation o f Data on Fluids from Geothermal Resources in the United States, in: LBL-5936, Lawrence Berkeley Laboratory, Berkeley, California, 1978.
[4] J.E. Harrar, C.H. Otto, S.B. Deutscher, R.W. Ryon, G.E. Tardiff, Studies of Brine Chemistry, Precipitation of Solids, and Scale Formation at the Salton Sea Geothermal Field, in: UCRL-52640, Lawrence Livermore National Laboratory, Livermore, California, 1979.
[5] P. Dobson, N. Araya, M. Brounce, M. Busse, M.K. Camarillo, L. English, J. Humphreys, B. Kalderon-Asael, M. McKibben, D. Millstein, N. Nakata, Characterizing the Geothermal Lithium Resource at the Salton Sea, in: P. Dobson (Ed.) A Project Report to the U.S. Department of Energy, Office of Energy Efficiency & Renewable Energy, Geothermal Technologies Office, Lawrence Berkeley National Laboratory, 2023.
[6] J.E. Harrar, C.H. Otto Jr, S.B. Deutscher, R.W. Ryon, G.E. Tardiff, Studies of brine chemistry, precipitation of solids, and scale formation at the Salton Sea geothermal field in: UCRL-52640, Lawrence Livermore National Lab, Livermore, CA, USA, 1979.