


RESOURCES | post
Array

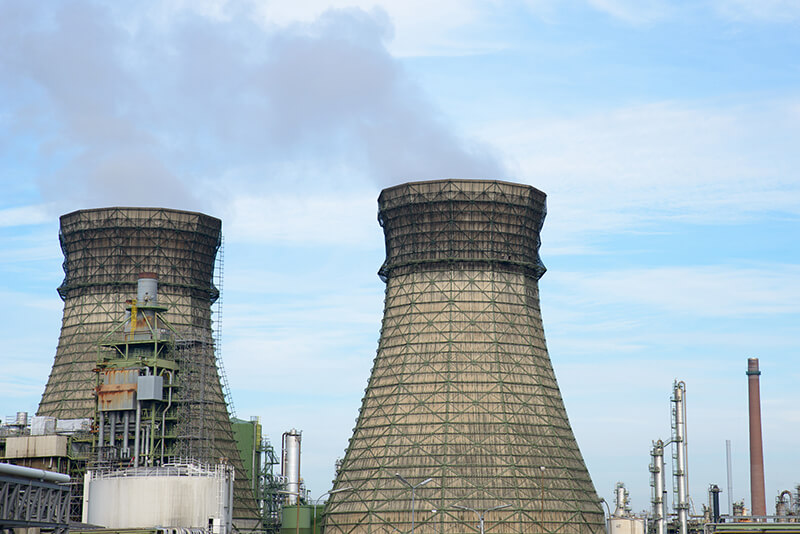
A cooling tower is a specialized heat exchanger in which air and water are brought into direct contact to reduce the water’s temperature. As this occurs, a small volume of water evaporates, reducing the temperature of the water being circulated through the tower and the whole industrial or air-conditioning system.
Water, which has been heated by an industrial process is pumped to the cooling tower through pipes. The water sprays through nozzles onto banks of material called “fill,” which slows the flow of water through the cooling tower. For better heat exchange it is important to expose as much water surface area as possible for maximum air-water contact. The air is pulled through the tower by an electric fan. Sometimes water cooling towers are huge constructions.
Heat leaves the recirculating cooling tower water through evaporation. This is called evaporative cooling. The colder water then reenters the industrial system and the cooling cycle repeats over and over again. The warm water entered into the cooling tower passes through some nozzles which spray the water into small droplets across the fill, which increases the surface area of water and allows for better heat loss through greater evaporation. The fan on top of the water cooling tower brings in air from the bottom of the tower and moves it up and out in the opposite direction of the warm condenser water at the top of the unit (see Figure 1).
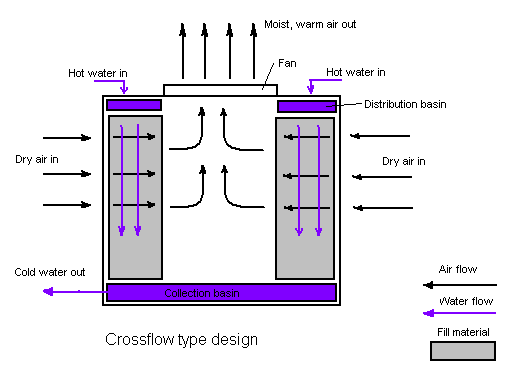
Figure 1. Water tower in a counterflow design. The air flow is directly opposite to the water flow. Air flow first enters an open area beneath the fill media and is then drawn up vertically.
As an alternative, water towers with the crossflow design are used.
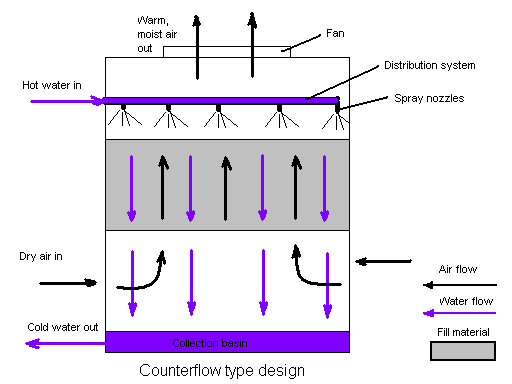
Figure 2. Water tower in a crossflow design. The airflow is directed perpendicular to the water flow. Airflow enters one or more vertical faces of the cooling tower to meet the fill material. Water flows (perpendicular to the air) through the fill by gravity.
Problems with corrosion and scaling in cooling towers
If cooling tower water isn’t properly treated, corrosion can occur. The costs of damage caused by corrosion and scale worldwide in cooling towers, boilers, and pipes escalated to more than $100 billion per year [1]. Severe corrosion in cooling towers is connected with the specific mass transfer conditions between liquid and gas phases in them. Thus Figure 4 shows the calculated (by using OLI software) corrosion rates of carbon steel in pure aerated water under static and full agitation hydrodynamic conditions.
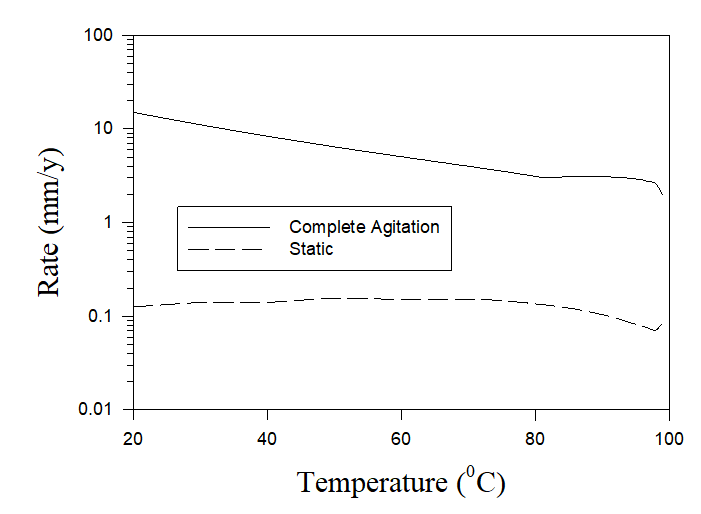
Figure 4. The calculated rates of carbon steel in pure aerated water under static and full agitation hydrodynamic conditions.
As we can see, there is a huge difference in corrosion rates (two orders of magnitude) depending on hydrodynamical conditions. As it was mentioned above, one of the aims of the design of water cooling towers is to provide the maximum possible contact between the air and the small drops or thin layers of water in order to obtain the best condition of the heat exchange. Under these conditions the liquid (in the form of small drops or thin layers) can be considered to be saturated by the air and, accordingly, the full agitation of the cooling water can be considered an adequate approximation to the real hydrodynamic condition in the water cooling towers. Accordingly, Figure 4 shows that the application of non-treated water in water cooling towers can lead to unacceptable rates of corrosion.
One major type of problem in cooling water circuits along with corrosion is scaling. These problems are strongly interrelated, and corrective actions taken to treat one of them frequently have repercussions on the other. Scaling occurs when the water has high levels of minerals like calcium carbonate, which can build up on surfaces. Slight scaling can be considered beneficial in that the inside surfaces of metal pipes become coated with harmless minerals that act as a barrier to corrosion. However, the experiment shows that the presence of calcium carbonate and calcium sulfate as a scaling increases the corrosion rates for aluminum alloys and carbon steel [2]. In many cases, the defects in scale film can cause pitting and galvanic corrosion. Further scale development typically leads to a reduction in heat transfer capacity, an increase in power consumption, and an increase in overall cooling system water and energy consumption. Accordingly, scaling can be considered as an unwanted phenomenon in water cooling towers.
Application of OLI software for evaluating corrosion and scaling in water cooling towers.
Let us assume that the inhibitor (or combination of inhibitors) has been chosen. This choice can be made on the basis of laboratory investigation, literature search, environmental requirements, maintenance cycle, and so on. Under these conditions, OLI software can help to determine the minimum concentration of chosen inhibitor(s) for the reliable protection of the construction and by doing so to reduce operating expenses.
In order to estimate this minimum concentration a user need to perform the composition surveys relative to the concentrations of investigated inhibitors (or series of surveys for different temperatures and hydrodynamic conditions) and choose the minimum concentration from the condition of the maximum possible corrosion rate. Examples of such calculations can be found in Ref. 3. All calculations performed for Na2HPO4, Na2SiO3, and Na2CrO4 inhibitors showed excellent agreement with experiments [3]. Additional calculations for some phosphate (Na3PO4), molybdate (Na2MO4), and nitrite (NaNO2) inhibitors are shown in Figure 5. 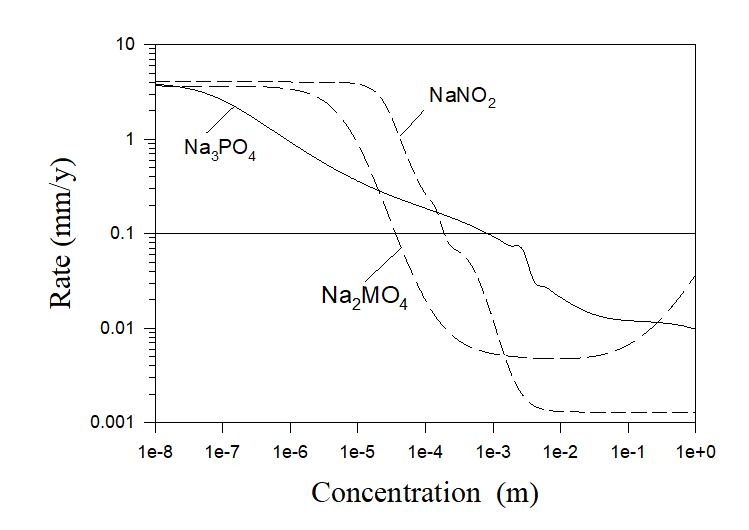
Figure 5. Corrosion rates of carbon steel in pure aerated water as a function of inhibitor concentrations at T = 250 C and at full agitation.
If, for example, the acceptable rate of corrosion damage is chosen to be 0.1 mm/y the corresponding minimum concentration of the inhibitor can be found as the intersection of the horizontal line Rate = 0.1mm/y with the corresponding to the chosen inhibitor plot.
It must be noted that calculations shown in Figure 5 correspond to the idealized case of the pure aerated water with inhibitor additions. Accordingly, in this case practically no scaling can be observed. Under real conditions, cooling water has a hardness (sometimes essential). As an example, let us consider some real case of the cooling water with the composition 7×10⁻³ m NaCl, 5.4×10⁻³ m Na2SO4, 6.25×10⁻⁴ m CaCO3 and 6.25×10⁻⁴ m MgCO3 [4]. The corresponding results of calculations are shown in Figure 6.
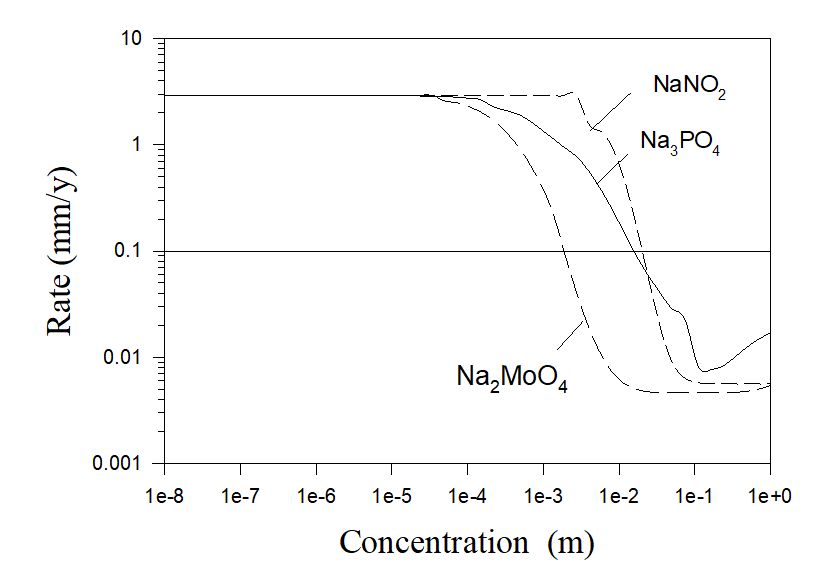
Figure 6. Corrosion rates of carbon steel in simulated aerated cooling water (7×10⁻³ m NaCl, 5.4×10⁻³ m Na2SO4, 6.25×10⁻⁴ m CaCO3 and 6.25×10⁻⁴ m MgCO2) as a function of inhibitor concentrations at T = 250 C and at full agitation.
As we can see, usually it is necessary to use more amount of corrosion inhibitors in hard water in comparison with pure water in order to substantially reduce corrosion rates. But the main difference between these two cases is that substantial scaling is observed in the case of hard water even in the absence of corrosion inhibitors.
Usually, several semiempirical indexes (Langelier (LSI), Ryznar (RSI), Practical (PSI) indexes) are used for predicting carbonate scale in cooling towers and other water systems including drinking water [5]. There is an online calculator for calculating LSI and RSI indexes [6]. However, the practical application of this calculator requires preliminary estimation of such values as a (TDS) total dissolved solids or conductivity of the solution, concentration of Ca2+ and HCO3– in the solution, and pH.
In addition, strictly speaking, these indexes can be used only when the precipitate is calcium carbonate. Thus, for example, when calcium phosphate is the controlling scaling species the LSI, RSI, and PSI indexes cannot be used in this case. As it was mentioned in Ref. 4, “If any of these indexes are used, as has been done by a number of vendors, the results are in error and invalid. This is often misleading to the end-user who believes the indexes are providing valid information. These indexes cannot be effectively used with a phosphate-based treatment program.”
The unique particularity of OLI software implies that this software allows users to estimate corrosion rates in water systems and simultaneously simply predict scaling in these systems. To do so, it is necessary to check the list of species output (true species) in the report after performing corrosion rates calculations. If there is one (or several) species in the solid phase, it means that scaling takes place. In addition, the OLI software yields the exact chemical composition of scales that sometimes can be important. Thus, under conditions shown in Figure 5 calculations yield that in the cases of Na2MO4 and NaNO2 inhibitor scales exist in the form of calcite (CaCO3) and brucite (Mg(OH)2), whereas in the case of the Na3PO4 inhibitor, the scale exists in the form of hydroxyapatite (Ca5(OH)(PO4)).
Usually, a class of specialty chemicals (so-called scale inhibitors (SIs)) are used to slow or prevent scaling in water systems. The list of scale inhibitors that are widely used in cooling and oil processing systems can be found in the literature. The simplest example of scale inhibitors is sulfuric acid (H2SO4). OLI software gives users the simplest working tool to estimate the effectiveness of different scaling inhibitors in practical systems (along with the simultaneous estimation of corrosion inhibitors for reducing corrosion rates).
Figure 7 shows an example of predicting corrosion rates in practical systems. Calculations were performed for three solutions: (A) untreated solution mentioned above (7×10⁻³ m NaCl, 5.4×10⁻³ m Na2SO4, 6.25×10⁻⁴ m CaCO3, 6.25×10⁻⁴ m MgCO2), (B) untreated solution + 5×10⁻³ m NaNO2 + 10-3 m H2SO4, and (C) untreated solution + 2×10⁻² m NaNO2 + 2×10⁻³ m H2SO4. The corresponding pHs of these solutions are shown in Figure 8.
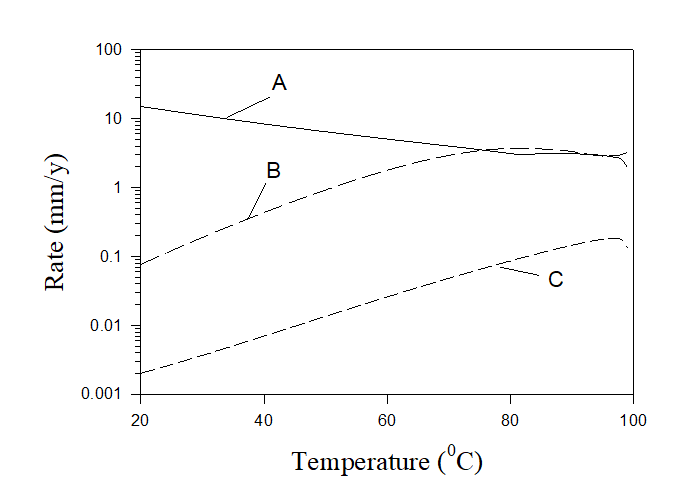
Figure 7. Rates of corrosion of carbon steel for different solutions at complete agitation.
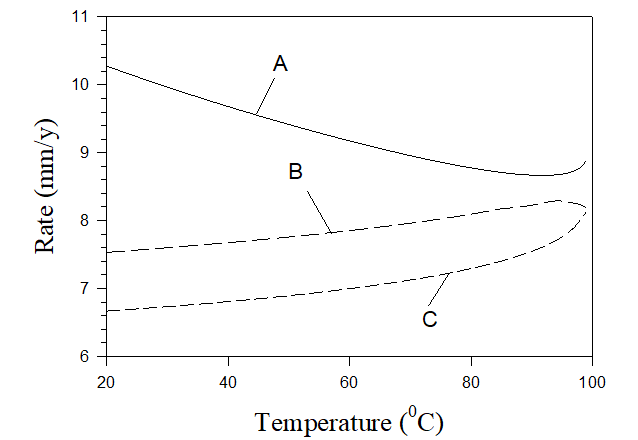
Figure 8. pH of corresponding solutions shown in Figure 7.
As we can see the rate of corrosion in untreated cooling water (solution A) is unacceptable and it can be also found that scaling takes place at any temperature (in the forms of calcite and brucite). In the case of solution B rate of corrosion is acceptable for sufficiently low temperatures only and scales appear at T> 85 0C (in the form calcite) and at T > 94 0C (in the form of brucite). In case C the rate of corrosion is low at any temperature and there is also no scaling at any temperature. Accordingly, solution C can be recommended for application in water cooling towers. Figure 8 also shows that solution C is approximately neutral which is a good circumstance from the environmental point of view.
Conclusion
Due to the specific heat and mass transfer conditions in water cooling towers, rates of corrosion on the metal surfaces of these towers can be extremely high. In parallel with corrosion, scaling represents a substantial threat to the cooling towers. Thus, the defects in scale film can cause pitting and galvanic corrosion. Further scale development typically leads to a reduction in heat transfer capacity, an increase in power consumption, and an increase in overall cooling system water and energy consumption. If cooling tower water isn’t properly treated, corrosion and scaling can substantially reduce the service life of constructions.
OLI software yields a reliable and simple tool for predicting corrosion rates and scaling appearing for different combinations of corrosion and scaling inhibitors. Moreover, OLI software can predict also the exact chemical composition of scales which can be important in some cases. Such calculations allow users to predict the service life of the construction without repairing it or to choose the proper combination of corrosion and scaling inhibitors in order to reduce the cost of operation of cooling towers and/or to satisfy environmental requirements.
References
- Colic, A. Chien, D. Morsea, Croatica Chemica Acta (CCA), 71 (4) 905-916 (1998).
- R. Osorio-Celestino et al., ACS Omega 2020, 5, 17304−17313.
- Anderko, P.McKenzie, and R.D. Young, Corrosion, 57 (3), 202-213 (2001).
- M. Mustafa and S. M. Dulal, Corrosion. 52 (1996), p.16.
- S. Puckorius and J.M. Brooke, Corrosion, 47 (4), (1991), 280-284.
- https://www.lenntech.com.
Fig 1 & 2. Edreher at the English-language Wikipedia, CC BY-SA 3.0 <http://creativecommons.org/licenses/by-sa/3.0/>, via Wikimedia Commons


